


Honeywell International Inc Stock (HON) Closed Down by 5.28% on Aug 11: Drivers Behind the Movement



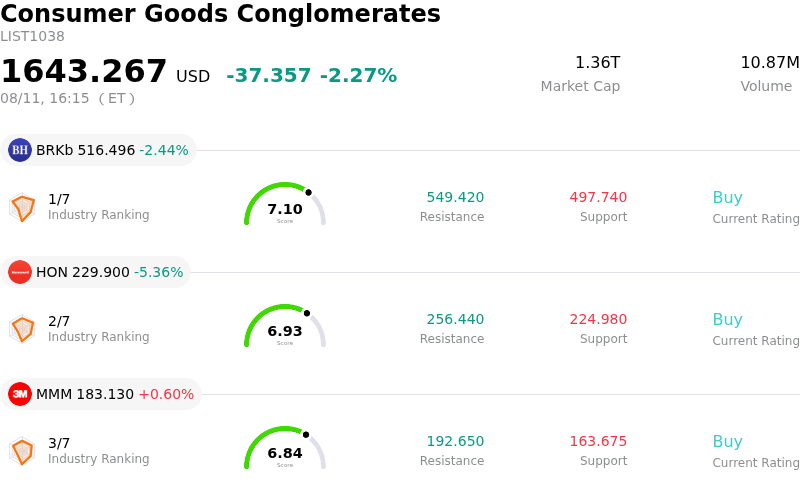
Honeywell International Inc (HON) closed down by 5.28%. The Consumer Goods Conglomerates sector is down by 2.27%. The company underperformed the industry. Top 3 stocks by turnover in the sector: Berkshire Hathaway Inc (BRKb) down 2.44%; Honeywell International Inc (HON) down 5.36%; 3M Co (MMM) up 0.60%.
What is driving Honeywell International Inc (HON)’s stock price down today?
Honeywell International experienced notable downward pressure during the trading session, driven by a combination of cautionary executive commentary at a major industry conference and lingering spillover sentiment from recent structural shifts. Management presented at Deutsche Bank's Chicago Industrials Summit, outlining the company's multi-year operational roadmap following its portfolio overhaul. While executive leadership reiterated long-term growth objectives and healthy backlog momentum across core automation segments, management's explicit acknowledgment of uneven regional demand and the necessity of maintaining conservative buffers in forward forecasts tempered near-term market enthusiasm.
The sentiment was further influenced by ongoing market digestion of the company's major corporate separation. Having recently completed the spin-off of its aerospace unit alongside divestitures of non-core productivity and workflow solutions businesses, Honeywell is transitioning into a pure-play industrial technology and automation enterprise. However, broader investor sentiment toward the industrial automation sector has been sensitive to lingering supply chain bottlenecks, margin dynamics, and persistent macroeconomic uncertainty in key international markets. Consequently, market participants reacted to the cautious tone by repricing near-term execution risks.
From an institutional perspective, significant portfolio restructuring often triggers equity rebalancing and heightened intraday volatility as funds adjust exposures to fit pure-play enterprise risk profiles. While Wall Street analysts recognize Honeywell's healthy long-term fundamentals, solid backlog, and expansion in high-margin software and services, the conservative tone regarding near-term regional demand prompted tactical profit-taking and defensive repositioning across institutional portfolios.
Technical Analysis of Honeywell International Inc (HON)
Technically, Honeywell International Inc (HON) shows a MACD (12,26,9) value of -0.053, indicating a neutral signal. The RSI at 55.959 suggests neutral condition and the Williams %R at 43.859 suggests buy condition. Please monitor closely.
Media Coverage of Honeywell International Inc (HON)
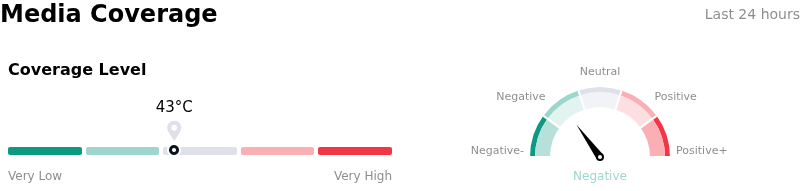
In terms of media coverage, Honeywell International Inc (HON) shows a coverage score of 43, indicating a moderate level of media attention. The overall market sentiment index is currently in bearish zone.
Fundamental Analysis of Honeywell International Inc (HON)
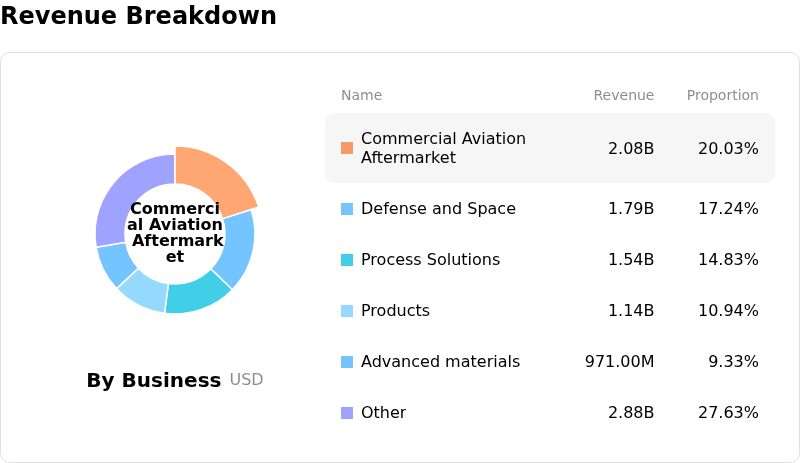
Honeywell International Inc (HON) is in the Consumer Goods Conglomerates industry. Its latest annual revenue is $37.44B, ranking 3 in the industry. The net profit is $4.73B, ranking 3 in the industry. Company Profile
Over the past month, multiple analysts have rated the company as Buy, with an average price target of $319.94, a high of $490.00, and a low of $237.00.
More details about Honeywell International Inc (HON)
Company Specific Risks:
- Severe Guidance Downgrades Post-Spinoff: Honeywell's updated full-year 2026 guidance projected earnings per share of $8.05–$8.35 and revenue of $19.8B–$20.0B, missing previous Wall Street consensus estimates ($10.78 EPS and $24.1B revenue) following its structural corporate breakup.
- Supply Chain Bottlenecks and Margin Compression: Ongoing mechanical parts supply chain constraints have restricted production capacity, forcing a tilt toward lower-margin original equipment deliveries over high-margin aftermarket solutions and driving quarterly operating margin contraction.
- High Separation Costs and Execution Overhead: Corporate restructuring and the spinoff of its aerospace division generated approximately $100 million in separation-related costs and inventory obsolescence charges, elevating operational drag and highlighting execution vulnerabilities.
- Analyst Skepticism and Near-Term Catalyst Deficit: Wall Street analysts downgraded expectations and characterized the stock as entering a "penalty box" due to missed initial guidance targets, citing a lack of positive second-half catalysts and lingering top-line execution risks.
This article may include AI-generated content that is human-reviewed, which is for reference and general information purposes only and does not constitute investment advice.
Recommended Articles








Comments (0)
Click the $ button, enter the symbol, and select to link a stock, ETF, or other ticker.