


Texas Instruments Inc Stock (TXN) Moved Down by 3.38% on Jul 23: Drivers Behind the Movement



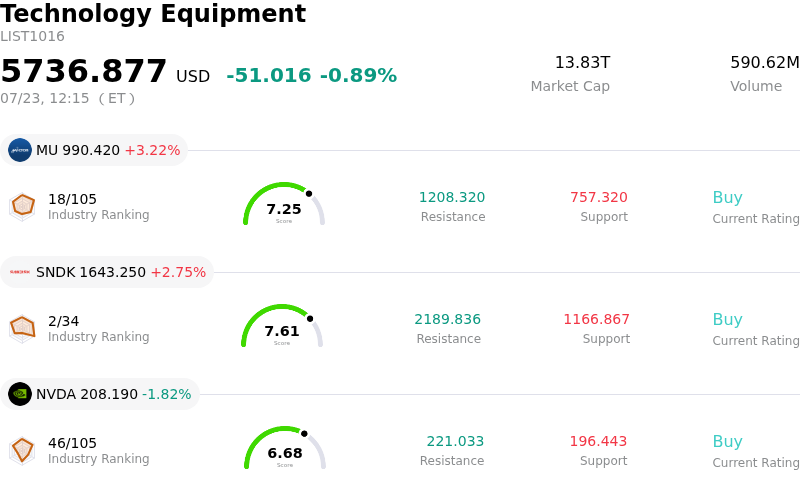
Texas Instruments Inc (TXN) moved down by 3.38%. The Technology Equipment sector is down by 0.89%. The company underperformed the industry. Top 3 stocks by turnover in the sector: Micron Technology Inc (MU) up 3.22%; SanDisk Corporation (SNDK) up 2.68%; NVIDIA Corp (NVDA) down 1.82%.
What is driving Texas Instruments Inc (TXN)’s stock price down today?
Texas Instruments is facing downward pressure following the release of its latest quarterly financial results and forward-looking commentary. The primary driver of this movement appears to be a cautious outlook regarding the recovery of the industrial and automotive sectors. These segments represent a significant portion of the company's revenue base, and any suggestion that the inventory digestion phase is extending beyond previous estimates tends to trigger a reassessment of the stock's near-term valuation. Investors are particularly sensitive to signs that the anticipated cyclical rebound is losing momentum.
Beyond company-specific guidance, the broader semiconductor industry is grappling with a shift in market sentiment. While artificial intelligence remains a dominant theme for the broader tech sector, analog chipmakers like Texas Instruments are more closely tied to traditional economic cycles. Recent industry data suggests a cooling in global manufacturing activity, which directly impacts demand for the company's embedded processing products. Furthermore, the company's commitment to substantial capital expenditures for domestic manufacturing facilities continues to weigh on free cash flow projections. While this strategy is designed to secure a long-term competitive advantage, it creates a drag on financial flexibility during periods of fluctuating demand.
Institutional sentiment has also been impacted by recent adjustments in analyst forecasts. Several brokerages have revised their price targets downward, citing concerns over margin compression and a slower recovery in high-margin industrial applications. This has led to a degree of portfolio de-risking among large-scale investors who are seeking more defensive positioning amidst macroeconomic uncertainty. Additionally, broader market volatility and fluctuations in the interest rate environment have made capital-intensive technology stocks less attractive in the short term, exacerbating the intraday decline as automated trading systems and retail sentiment react to the break in technical support levels.
Finally, geopolitical considerations and currency fluctuations continue to play a role in the company's performance. As a global provider with significant international exposure, Texas Instruments is sensitive to trade dynamics and the relative strength of the dollar. Any perceived risks to the supply chain or potential regulatory shifts in key global markets add a layer of complexity to the investment thesis. The combination of these fundamental and macroeconomic factors has created a challenging environment for the stock, leading to the notable volatility observed in the current session.
Technical Analysis of Texas Instruments Inc (TXN)
Technically, Texas Instruments Inc (TXN) shows a MACD (12,26,9) value of -3.165, indicating a sell signal. The RSI at 48.568 suggests neutral condition and the Williams %R at 58.563 suggests sell condition. Please monitor closely.
Media Coverage of Texas Instruments Inc (TXN)
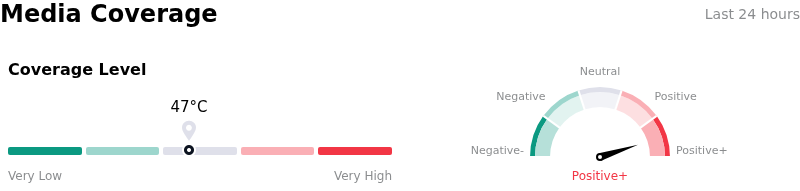
In terms of media coverage, Texas Instruments Inc (TXN) shows a coverage score of 47, indicating a moderate level of media attention. The overall market sentiment index is currently in extremely bullish zone.
Fundamental Analysis of Texas Instruments Inc (TXN)
Texas Instruments Inc (TXN) is in the Technology Equipment industry. Its latest annual revenue is $17.68B, ranking 13 in the industry. The net profit is $4.97B, ranking 9 in the industry. Company Profile
Over the past month, multiple analysts have rated the company as Hold, with an average price target of $293.91, a high of $400.00, and a low of $184.59.
More details about Texas Instruments Inc (TXN)
Company Specific Risks:
- Activist-Driven Strategic Conflict: The disclosure of a $2.5 billion stake by Elliott Investment Management has introduced significant execution risk, as the activist firm publicly pressures management to scale back its "spend-at-all-costs" capital expenditure strategy and address a massive drop in free cash flow.
- Severe Free Cash Flow Erosion: Recent financial analysis highlights that Texas Instruments' free cash flow has plummeted to approximately $1.47 per share, down significantly from its 2022 peak of $6.40, driven by an aggressive $5 billion annual infrastructure investment plan that has yet to yield revenue offsets.
- Prolonged Industrial De-stocking: Despite some recovery in personal electronics, the industrial segment—the company's largest revenue driver—continues to face cyclical headwinds and inventory imbalances, creating uncertainty regarding the timing of a sustainable demand bottom.
- Structural Margin Compression: The aggressive expansion of 300mm wafer fabrication capacity is resulting in higher-than-anticipated depreciation expenses, which are expected to weigh heavily on gross margins in the near term while fab utilization remains below optimal levels due to sluggish macro demand.
This article may include AI-generated content that is human-reviewed, which is for reference and general information purposes only and does not constitute investment advice.
Recommended Articles










Comments (0)
Click the $ button, enter the symbol, and select to link a stock, ETF, or other ticker.