


Newmont Corporation Stock (NEM) Moved Up by 3.94% on Jul 22: Drivers Behind the Movement



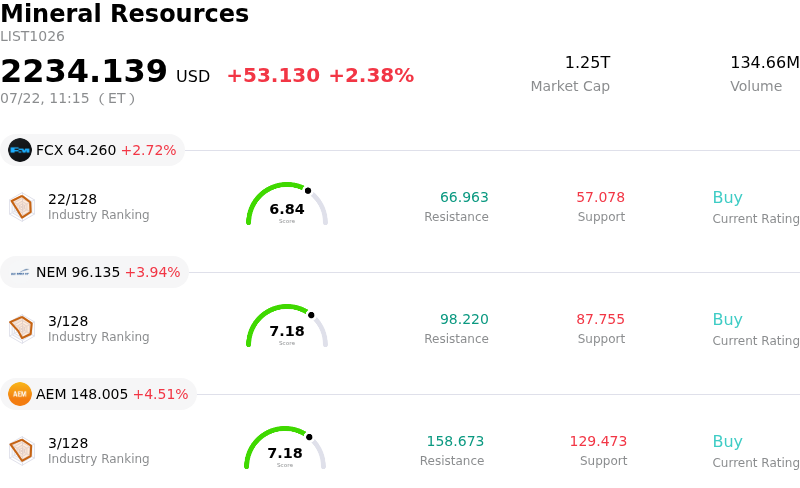
Newmont Corporation (NEM) moved up by 3.94%. The Mineral Resources sector is up by 2.38%. The company outperformed the industry. Top 3 stocks by turnover in the sector: Freeport-McMoRan Inc (FCX) up 2.72%; Newmont Corporation (NEM) up 3.94%; Agnico Eagle Mines Ltd (AEM) up 4.51%.
What is driving Newmont Corporation (NEM)’s stock price up today?
Newmont’s upward momentum is primarily driven by a significant rally in spot gold prices, which has provided a powerful tailwind for the world’s largest gold producer. Investors are reacting to a combination of cooling inflationary pressures and a shift in Federal Reserve rhetoric toward a more dovish stance. As real interest rates begin to stabilize or decline, the opportunity cost of holding non-yielding assets like bullion diminishes, leading to increased capital inflows into the precious metals sector and its leading equities.
The company’s recent operational performance has also contributed to the positive sentiment. Newmont has been successfully executing its post-merger integration strategy, focusing on high-margin Tier 1 assets while divesting non-core operations. This streamlined portfolio is expected to enhance free cash flow generation and improve the overall cost structure, which is a critical metric for institutional investors in the mining industry. The market is particularly optimistic about the production ramp-up at several key mines, which suggests a stronger production profile for the latter half of the fiscal year.
Macroeconomic instability and ongoing geopolitical tensions have further reinforced Newmont’s appeal as a defensive play. With market volatility showing signs of elevation and uncertainty surrounding global trade policies, institutional portfolio managers are rotating back into traditional safe-haven equities. This rotation is evident in recent fund flow data, which indicates a renewed interest from large-scale asset managers seeking to hedge against broader market equity risks through diversified commodity exposure.
Furthermore, the anticipation of the company’s upcoming quarterly financial results is creating a bullish setup. Analysts have been revising their earnings estimates upward, citing higher realized gold prices and better-than-expected discipline in all-in sustaining costs. If Newmont continues to meet its capital return commitments, including its competitive dividend policy and share buyback programs, it will likely maintain its premium valuation relative to its peers in the gold mining industry.
Technical Analysis of Newmont Corporation (NEM)
Technically, Newmont Corporation (NEM) shows a MACD (12,26,9) value of -0.009, indicating a sell signal. The RSI at 43.099 suggests neutral condition and the Williams %R at 63.261 suggests sell condition. Please monitor closely.
Media Coverage of Newmont Corporation (NEM)
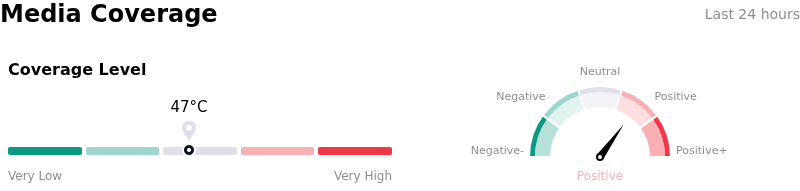
In terms of media coverage, Newmont Corporation (NEM) shows a coverage score of 47, indicating a moderate level of media attention. The overall market sentiment index is currently in bullish zone.
Fundamental Analysis of Newmont Corporation (NEM)
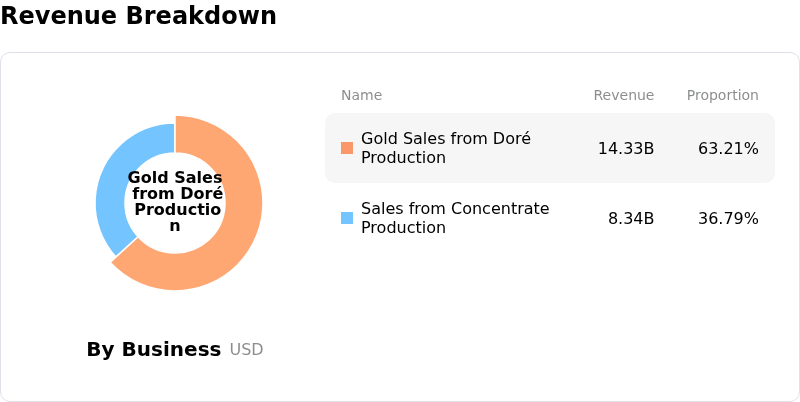
Newmont Corporation (NEM) is in the Mineral Resources industry. Its latest annual revenue is $22.67B, ranking 8 in the industry. The net profit is $7.08B, ranking 3 in the industry. Company Profile
Over the past month, multiple analysts have rated the company as Buy, with an average price target of $133.96, a high of $205.00, and a low of $64.32.
More details about Newmont Corporation (NEM)
p>Company Specific Risks:
- Escalated All-In Sustaining Costs (AISC): The Q3 earnings report revealed AISC of $1,611 per ounce, significantly exceeding analyst expectations of approximately $1,490 per ounce, indicating that inflationary pressures on labor and maintenance are eroding the benefits of record-high gold prices.
- Operational Performance Deficits: Production misses at the Lihir and Brucejack mines, attributed to unplanned maintenance and lower-than-anticipated ore grades, have raised institutional concerns regarding Newmont's ability to maintain its full-year production guidance.
- Heightened Capital Expenditure Requirements: Revised projections for growth projects, specifically the Tanami Expansion 2 and Cadia, indicate rising development costs that threaten to further constrain free cash flow and limit immediate shareholder capital returns.
- Asset Divestiture Execution Risk: Market volatility and the complexity of integrating the Newcrest acquisition have increased the risk that Newmont may not achieve optimal valuations or timelines for its planned $2 billion non-core asset sales, impacting its debt-reduction strategy.
This article may include AI-generated content that is human-reviewed, which is for reference and general information purposes only and does not constitute investment advice.
Recommended Articles










Comments (0)
Click the $ button, enter the symbol, and select to link a stock, ETF, or other ticker.