


Goldman Sachs Group Inc Stock (GS) Moved Up by 3.10% on Jul 21: What Signal Does It Send?



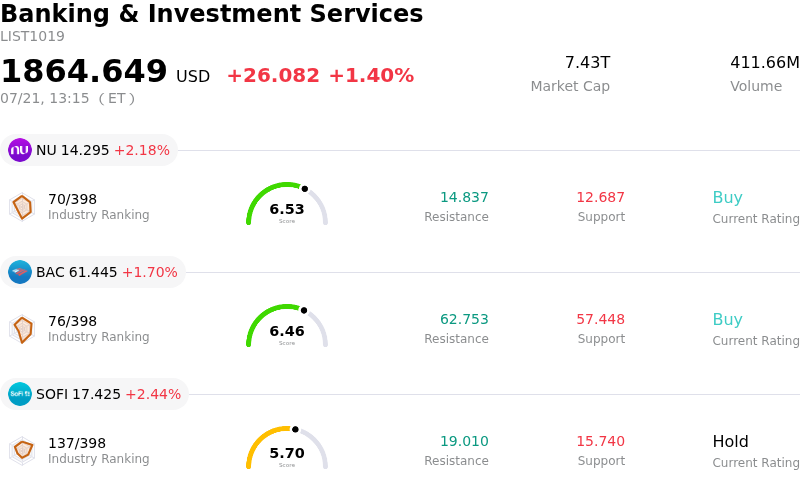
Goldman Sachs Group Inc (GS) moved up by 3.10%. The Banking & Investment Services sector is up by 1.40%. The company outperformed the industry. Top 3 stocks by turnover in the sector: Nu Holdings Ltd (NU) up 2.18%; Bank of America Corp (BAC) up 1.70%; SoFi Technologies Inc (SOFI) up 2.44%.
What is driving Goldman Sachs Group Inc (GS)’s stock price up today?
Goldman Sachs has experienced a notable upward trajectory as the market reacts to the firm's strategic pivot back to its core strengths in investment banking and global markets. The positive momentum is largely driven by a significant recovery in equity and debt underwriting, as corporate clients move forward with long-delayed capital raises and mergers. This resurgence in deal-making activity suggests that the firm is capturing a disproportionate share of the market as the initial wave of the mid-2026 earnings season highlights a broader recovery in institutional finance.
Macroeconomic conditions have further bolstered investor confidence. Recent data suggesting a stabilization in long-term interest rates has created a more favorable environment for the firm's asset and wealth management division. Investors are increasingly optimistic that the Federal Reserve's current stance will facilitate a soft landing, reducing the risk of credit defaults while simultaneously encouraging a pick-up in private equity exits. This macro backdrop is particularly beneficial for Goldman Sachs, given its high sensitivity to capital market cycles compared to its more consumer-oriented peers.
Internal operational efficiencies are also playing a critical role in the current price action. After successfully scaling back its retail banking ambitions, the firm has demonstrated improved return on equity and leaner cost structures. Institutional investors appear to be rewarding this focus, as evidenced by heavy buying volume during the trading session. The intraday volatility reflects a tug-of-war between short-term profit-takers and long-term institutional accumulators who view the current valuation as attractive relative to historical growth multiples and future earnings potential.
Furthermore, the competitive landscape has shifted in the firm's favor. As smaller regional players face continued regulatory scrutiny and capital constraints, dominant bulge-bracket firms are seeing a concentration of market share. This consolidation of power in the investment banking sector provides a tailwind for advisory fees. The market's reaction today underscores a broader belief that the company is well-positioned to lead the next cycle of global financial activity, provided that geopolitical tensions remain contained and market liquidity remains robust.
Analyst sentiment has also turned increasingly bullish, with several major brokerage houses revising their price targets upward in response to the strengthening IPO pipeline. The firm's ability to navigate volatile trading environments has historically been a key differentiator, and current market conditions are providing ample opportunities for the fixed income and equities trading desks to outperform expectations. This combination of structural strategic clarity and a supportive macro environment is currently the primary driver of the upward movement.
Technical Analysis of Goldman Sachs Group Inc (GS)
Technically, Goldman Sachs Group Inc (GS) shows a MACD (12,26,9) value of 0.027, indicating a buy signal. The RSI at 49.683 suggests neutral condition and the Williams %R at 65.541 suggests sell condition. Please monitor closely.
Media Coverage of Goldman Sachs Group Inc (GS)
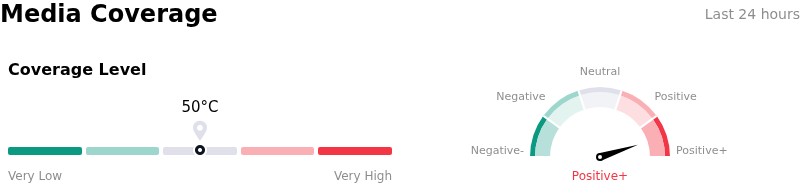
In terms of media coverage, Goldman Sachs Group Inc (GS) shows a coverage score of 50, indicating a moderate level of media attention. The overall market sentiment index is currently in extremely bullish zone.
Fundamental Analysis of Goldman Sachs Group Inc (GS)
Goldman Sachs Group Inc (GS) is in the Banking & Investment Services industry. Its latest annual revenue is $117.10B, ranking 2 in the industry. The net profit is $16.30B, ranking 1 in the industry. Company Profile
Over the past month, multiple analysts have rated the company as Hold, with an average price target of $1150.11, a high of $1325.00, and a low of $834.00.
More details about Goldman Sachs Group Inc (GS)
Company Specific Risks:
- Capital Structure Dilution: The announcement of a new preferred stock offering on July 20, 2026, has triggered intraday selling pressure as investors weigh the potential dilution of common share value and the increased cost of servicing senior dividend obligations in a volatile rate environment.
- Equities Trading Revenue Sustainability: Institutional analysts have voiced concerns that the record 72% surge in equities revenue reported in the July 14, 2026, earnings cycle is unsustainable, as it was heavily reliant on temporary spikes in volume from the SpaceX IPO and geopolitical-driven volatility rather than recurring core growth.
- Consumer Banking Exit Friction: The multi-year transition of the $20 billion Apple Card portfolio to JPMorgan Chase remains a primary execution risk, with the bank projecting a significant hit to net revenue through 2027 due to loan-portfolio markdowns and substantial contract termination expenses.
- Advisory Pipeline Vulnerability: Despite a record H1 for M&A, the firm’s investment banking division faces immediate downside risk from escalating geopolitical tensions in the Middle East, which analysts suggest could lead to a sudden freeze in the "mega-deal" activity that currently underpins the stock’s valuation.
This article may include AI-generated content that is human-reviewed, which is for reference and general information purposes only and does not constitute investment advice.
Recommended Articles










Comments (0)
Click the $ button, enter the symbol, and select to link a stock, ETF, or other ticker.