


Citigroup Inc Stock (C) Moved Down by 4.27% on Jul 14: Facts Behind the Movement



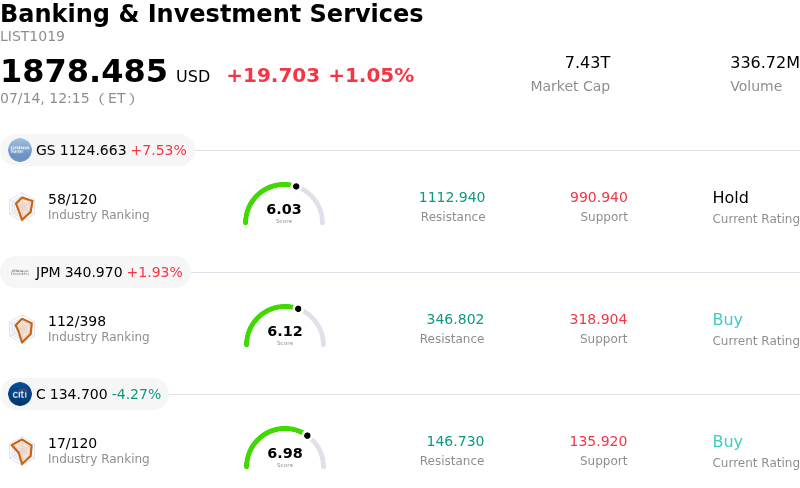
Citigroup Inc (C) moved down by 4.27%. The Banking & Investment Services sector is up by 1.05%. The company underperformed the industry. Top 3 stocks by turnover in the sector: Goldman Sachs Group Inc (GS) up 7.53%; JPMorgan Chase & Co (JPM) up 1.93%; Citigroup Inc (C) down 4.27%.
What is driving Citigroup Inc (C)’s stock price down today?
Citigroup shares experienced a notable decline today following the release of its latest quarterly financial results, which failed to reassure investors regarding the bank's long-term transformation timeline. While total revenue showed some resilience in investment banking and services, the bottom line was heavily impacted by higher-than-expected operating expenses. These costs are largely tied to the bank's massive, multi-year internal restructuring and the ongoing efforts to address long-standing regulatory consent orders. The market reacted negatively to the reality that the expenses required to modernize the firm's data infrastructure and risk management systems are proving more persistent than previously modeled.
A significant point of concern for institutional investors was the bank's guidance on net interest income and credit quality. Management signaled that the tailwinds from higher interest rates are beginning to peak as deposit costs rise and loan growth remains tepid across major markets. Furthermore, the bank reported an increase in provisions for credit losses, reflecting a more cautious outlook on the U.S. consumer. As delinquency rates in the credit card and retail services segments begin to normalize toward pre-pandemic levels, analysts are adjusting their risk-weighted return expectations for the coming fiscal year.
The regulatory environment continues to serve as a major overhang on the stock's valuation. During the earnings call, updates regarding the progress of data governance remediation suggested that the Federal Reserve and the Office of the Comptroller of the Currency remain unsatisfied with the pace of change. This regulatory friction limits the bank's ability to engage in more aggressive capital return programs, such as larger share buybacks, which many value-oriented investors were anticipating. The lack of a clear end date for these costly regulatory mandates has led to a discount in the bank's price-to-book ratio compared to its Tier 1 peers.
Broader macroeconomic pressures also contributed to the intraday volatility. As recent labor market data and inflation prints suggest a complex path for future central bank policy, the financial sector as a whole has faced renewed scrutiny. However, the specific underperformance of Citigroup today highlights idiosyncratic operational risks. Institutional portfolio adjustments have shown a rotation away from complex turnaround stories toward banks with more stable expense structures. Until the bank can demonstrate a consistent downward trend in its efficiency ratio and gain clear clearance from regulators, the stock is likely to remain sensitive to any signs of execution slippage.
Technical Analysis of Citigroup Inc (C)
Technically, Citigroup Inc (C) shows a MACD (12,26,9) value of -1.640, indicating a neutral signal. The RSI at 54.569 suggests neutral condition and the Williams %R at 66.541 suggests sell condition. Please monitor closely.
Media Coverage of Citigroup Inc (C)
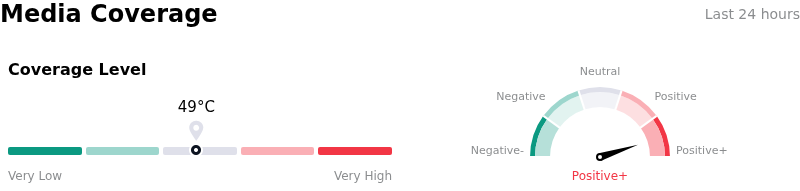
In terms of media coverage, Citigroup Inc (C) shows a coverage score of 49, indicating a moderate level of media attention. The overall market sentiment index is currently in extremely bullish zone.
Fundamental Analysis of Citigroup Inc (C)
Citigroup Inc (C) is in the Banking & Investment Services industry. Its latest annual revenue is $81.18B, ranking 4 in the industry. The net profit is $13.02B, ranking 3 in the industry. Company Profile
Over the past month, multiple analysts have rated the company as Buy, with an average price target of $152.35, a high of $180.00, and a low of $96.40.
More details about Citigroup Inc (C)
Company Specific Risks:
- Regulatory Resolution Plan Deficiencies: Recent feedback from the Federal Reserve and the FDIC identified "shortcomings" in Citigroup's 2023 resolution plan (living will), specifically regarding data integrity and the bank's ability to calculate liquidity needs during stress, potentially leading to increased regulatory oversight or capital surcharges.
- Persistent Internal Control Failures: The recent imposition of approximately $79 million in fines by UK regulators following a "fat-finger" trading error underscores ongoing vulnerabilities in the firm's global trade monitoring and risk management systems despite massive ongoing investment in automated controls.
- Execution Risk of Restructuring: Intraday volatility is driven by investor skepticism regarding the "simplification" strategy, as the bank navigates high severance costs and the operational complexity of exiting non-core international markets, which threatens the achievement of its medium-term Return on Tangible Common Equity (ROTCE) targets.
- Asset Quality and Credit Card Exposure: Increasing net charge-off rates and delinquency trends within the U.S. retail banking segment, particularly in branded cards and retail services, suggest a higher-than-anticipated need for loan loss provisioning as consumer credit conditions tighten.
This article may include AI-generated content that is human-reviewed, which is for reference and general information purposes only and does not constitute investment advice.
Recommended Articles






Comments (0)
Click the $ button, enter the symbol, and select to link a stock, ETF, or other ticker.