


Texas Instruments Inc Stock (TXN) Moved Down by 3.93% on Jul 13: Key Drivers Unveiled



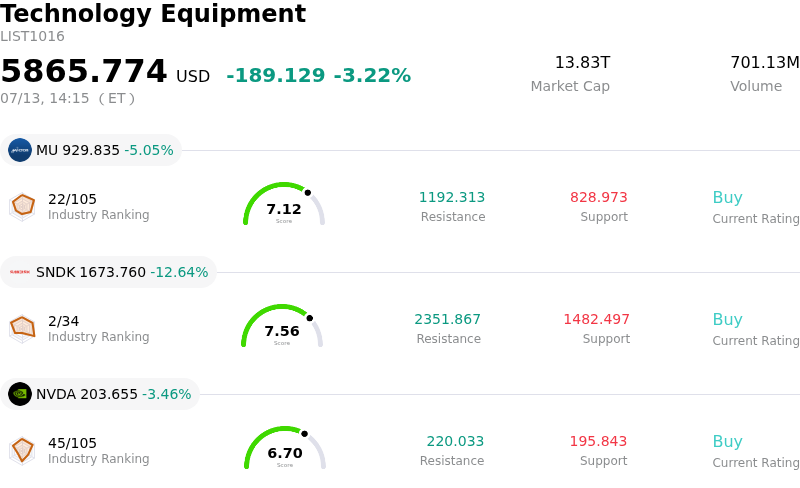
Texas Instruments Inc (TXN) moved down by 3.93%. The Technology Equipment sector is down by 3.22%. The company underperformed the industry. Top 3 stocks by turnover in the sector: Micron Technology Inc (MU) down 5.05%; SanDisk Corporation (SNDK) down 12.48%; NVIDIA Corp (NVDA) down 3.39%.
What is driving Texas Instruments Inc (TXN)’s stock price down today?
Texas Instruments is currently facing selling pressure as the broader semiconductor sector grapples with revised growth expectations for the second half of the year. The primary driver behind the recent volatility appears to be a cautious shift in sentiment regarding the industrial and automotive end-markets. These segments, which represent a significant portion of the company’s revenue mix, are showing signs of prolonged inventory digestion. Investors are increasingly concerned that the recovery in analog chip demand may be more sluggish than previously anticipated, leading to a de-risking of positions across the industry.
Adding to the downward momentum is a series of cautious updates from institutional analysts who have flagged potential margin compression. Texas Instruments has been aggressively investing in its internal manufacturing capacity, specifically its 300-millimeter wafer fabs. While this strategy is expected to provide long-term cost advantages and supply security, the high capital expenditures are resulting in elevated depreciation expenses. In a climate where revenue growth is cooling, these fixed costs weigh more heavily on the bottom line, prompting some funds to rotate out of the stock in favor of more capital-light competitors.
Macroeconomic factors are also playing a critical role in the current price action. Recent data indicating persistent inflationary pressures has fueled speculation that the Federal Reserve may maintain a restrictive monetary policy for longer than the market had hoped. Higher interest rates typically dampen capital spending in the industrial sector, directly impacting the order book for the company’s general-purpose analog products. Furthermore, the significant intraday volatility suggests that institutional investors are repositioning their portfolios ahead of the upcoming quarterly earnings announcement, reflecting heightened sensitivity to any potential guidance misses.
From a competitive standpoint, the landscape for embedded processing remains intense. While the company maintains a dominant market share and a robust balance sheet, the emergence of localized competitors in key international markets poses a long-term threat to its pricing power. The current market reaction underscores a broader concern that the cyclical peak for industrial semiconductors may have passed, leaving the stock vulnerable to further downward revisions in analyst forecasts if the demand environment does not show clear signs of stabilization in the coming months.
Technical Analysis of Texas Instruments Inc (TXN)
Technically, Texas Instruments Inc (TXN) shows a MACD (12,26,9) value of 0.185, indicating a buy signal. The RSI at 55.169 suggests neutral condition and the Williams %R at 38.747 suggests buy condition. Please monitor closely.
Media Coverage of Texas Instruments Inc (TXN)
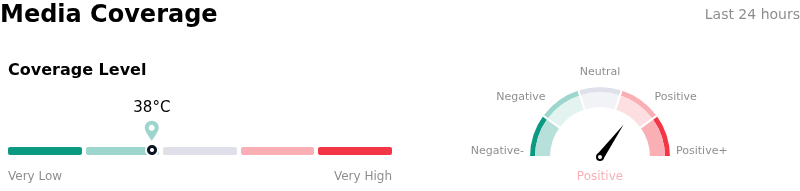
In terms of media coverage, Texas Instruments Inc (TXN) shows a coverage score of 38, indicating a low level of media attention. The overall market sentiment index is currently in bullish zone.
Fundamental Analysis of Texas Instruments Inc (TXN)
Texas Instruments Inc (TXN) is in the Technology Equipment industry. Its latest annual revenue is $17.68B, ranking 13 in the industry. The net profit is $4.97B, ranking 9 in the industry. Company Profile
Over the past month, multiple analysts have rated the company as Hold, with an average price target of $287.27, a high of $400.00, and a low of $184.59.
More details about Texas Instruments Inc (TXN)
p>Company Specific Risks:
- Extended Industrial Destocking: Recent institutional commentary highlights that the industrial end-market—Texas Instruments' largest revenue contributor—is experiencing a more persistent inventory correction than previously modeled, delaying the company's anticipated cyclical recovery.
- Negative Free Cash Flow Trends: Massive capital expenditures for the multi-year expansion of 300mm wafer fabrication facilities are severely constraining free cash flow, creating a valuation risk as the company maintains a high dividend payout ratio despite shrinking cash reserves.
- Automotive Segment Deceleration: Weakening demand signals in the global electric vehicle market and broader automotive production cuts pose a direct threat to the company’s Analog and Embedded Processing revenue, which has historically been a primary growth driver.
- Manufacturing Underutilization Charges: As new manufacturing capacity comes online during a period of soft demand, the company faces significant gross margin pressure from higher-than-expected depreciation and underutilization costs, potentially leading to downward revisions in upcoming earnings guidance.
This article may include AI-generated content that is human-reviewed, which is for reference and general information purposes only and does not constitute investment advice.
Recommended Articles







Comments (0)
Click the $ button, enter the symbol, and select to link a stock, ETF, or other ticker.