


Ge Vernova Inc Stock (GEV) Moved Down by 8.96% on Jul 7: Key Drivers Unveiled



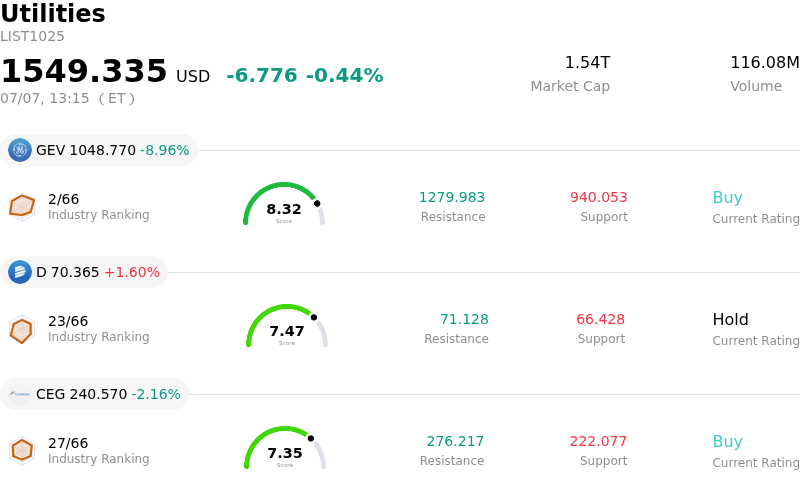
Ge Vernova Inc (GEV) moved down by 8.96%. The Utilities sector is down by 0.44%. The company underperformed the industry. Top 3 stocks by turnover in the sector: Ge Vernova Inc (GEV) down 8.96%; Dominion Energy Inc (D) up 1.60%; Constellation Energy Corp (CEG) down 2.16%.
What is driving Ge Vernova Inc (GEV)’s stock price down today?
Shares of GE Vernova experienced sharp downward movement on Tuesday, driven primarily by negative sentiment spilling over from the broader clean energy and utility sectors rather than any internal corporate updates. A key driver of this downturn was a high-profile downgrade of a major international competitor.
Barclays downgraded German energy giant Siemens Energy to a Sell rating, raising sudden and severe concerns about the immediate trajectory of the global artificial intelligence infrastructure buildout. Because GE Vernova has run up rapidly to become a leading hardware and grid play on AI data centers, its high-multiple valuation has made it highly sensitive to sector-wide sentiment shifts. As Siemens Energy tumbled, GE Vernova followed suit, sliding in sympathy as investors locked in profits.
Prior to today’s selloff, the stock had climbed significantly year-to-date, fueled by an expanding multi-billion-dollar backlog and strong equipment orders. However, trading at an elevated forward earnings multiple, the stock’s premium valuation left very little room for error. This premium, combined with the exhaustion of buying momentum from its recent inclusion in major passive indexes like the Russell Top 50, has left the stock vulnerable to profit-taking and broader macroeconomic and industry-specific headwinds.
Market participants also appear to be reassessing risks ahead of the company's second-quarter earnings release scheduled for late July. While the company's power and electrification segments remain robust, persistent unprofitable drag in its wind segment and potential execution bottlenecks in converting its massive backlog into realized revenue continue to loom over long-term projections. The sharp intraday volatility highlights how sensitive highly valued AI-adjacent infrastructure stocks have become to any perceived friction in global demand.
Technical Analysis of Ge Vernova Inc (GEV)
Technically, Ge Vernova Inc (GEV) shows a MACD (12,26,9) value of 27.456, indicating a buy signal. The RSI at 60.493 suggests neutral condition and the Williams %R at 18.401 suggests overbought condition. Please monitor closely.
Media Coverage of Ge Vernova Inc (GEV)
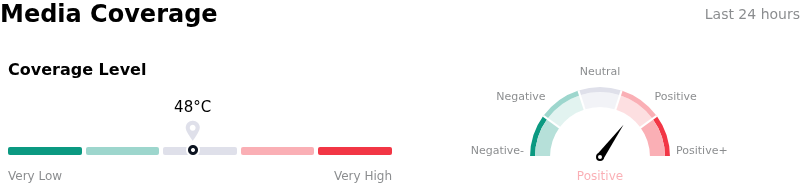
In terms of media coverage, Ge Vernova Inc (GEV) shows a coverage score of 48, indicating a moderate level of media attention. The overall market sentiment index is currently in bullish zone.
Fundamental Analysis of Ge Vernova Inc (GEV)
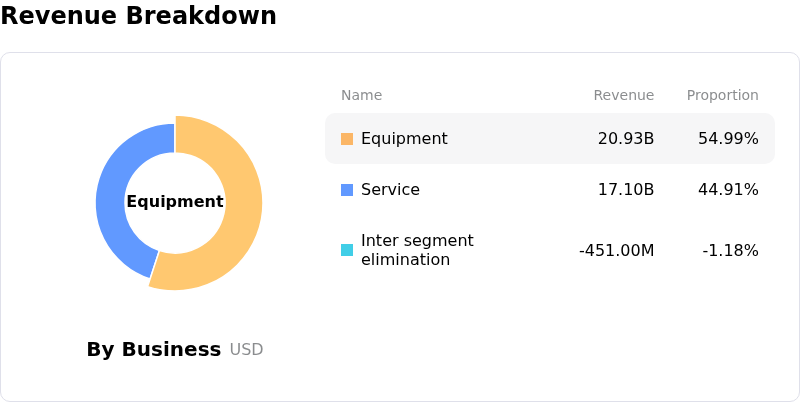
Ge Vernova Inc (GEV) is in the Utilities industry. Its latest annual revenue is $38.07B, ranking 2 in the industry. The net profit is $4.88B, ranking 4 in the industry. Company Profile
Over the past month, multiple analysts have rated the company as Buy, with an average price target of $1206.74, a high of $1424.00, and a low of $836.00.
More details about Ge Vernova Inc (GEV)
Company Specific Risks:
- Severe Competitor Sympathy Pressures: Following Barclays' downgrade of direct sector rival Siemens Energy to Sell, GE Vernova’s stock has suffered sharp sympathy sell-offs, illustrating extreme vulnerability to growing broader analyst nervousness over the long-term runway of the artificial intelligence infrastructure and data center buildout.
- Executive Insider Selling: Market sentiment has deteriorated due to prominent, high-level insider selling, including the CEO and other top executives unloading shares, which has exacerbated downward technical pressure and triggered profit-taking after the stock reached fresh highs.
- Persistent Offshore Wind Segment Overhang: While Gas and Electrification segments perform well, the Wind division continues to act as a significant drag on margins due to input cost inflation, reduced onshore delivery volumes, costly legacy offshore project liabilities, and a projected $400 million EBITDA loss for fiscal year 2026.
- Valuation Multiples Pricing in Perfection: Trading at a premium multiple of over 60 times forward earnings, the stock's current valuation has already fully priced in flawless operational execution, leaving zero margin for error regarding utility-scale backlog conversion, regional grid interconnection delays, or looming tariff and supply chain costs.
This article may include AI-generated content that is human-reviewed, which is for reference and general information purposes only and does not constitute investment advice.
Recommended Articles









Comments (0)
Click the $ button, enter the symbol, and select to link a stock, ETF, or other ticker.