

Bitcoin (BTCUSD) Suddenly Goes up 1.01% on Jun 26: What's Driving This

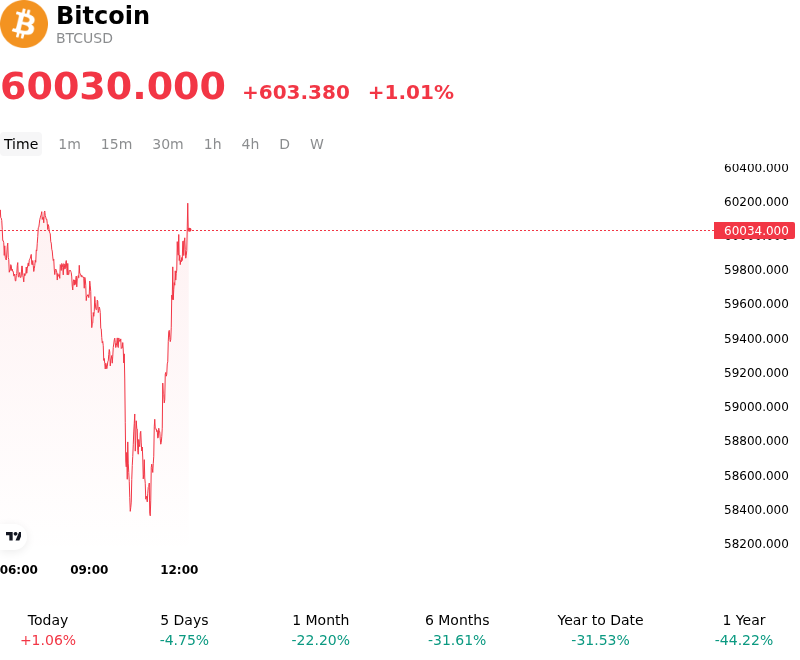
Bitcoin (BTCUSD) is up 1.01% at Jun 26 00:20(ET), now at $60030, with a 7-day down of 5.05%.
What is driving Bitcoin (BTCUSD)’s stock price up today?
Bitcoin demonstrated significant intraday volatility, staging a technical rebound and advancing after testing a critical multi-month support zone. This recovery reflects a combination of technical exhaustion, stabilizing macroeconomic expectations, and the resolution of major derivatives positioning.
The primary catalyst for the intraday turn was the defense of confluent technical support in the fifty-eight thousand to sixty thousand dollar range. Having reached oversold territory on major momentum indicators following a steep multi-day slide, the asset encountered strong demand from institutional dip-buyers. This zone, representing a key long-term retracement level and historical support, triggered a short-term exhaustion low and subsequent relief bounce, especially as the selling pressure that had plagued the market throughout June began to show signs of exhaustion.
On the macroeconomic front, the digestion of the U.S. Personal Consumption Expenditures inflation data provided some relief. While the index initially triggered risk-off sentiment due to elevated figures, broader market analysis revealed the data was within expected bounds and below worst-case projections. Easing fears of runaway inflation led to a marginal contraction in Treasury yields, with the two-year yield dipping slightly. This stabilization in global liquidity conditions helped restore a degree of risk appetite, prompting capital to flow back into major digital assets.
Simultaneously, the spot market benefited from the resolution of a massive ten point six billion dollar options expiry on Deribit. In the lead-up to the expiration, heavy put-option hedging and negative options skew had exerted downward pressure on spot prices. Once the expiration window opened, market makers unwound their defensive delta-hedges, and the removal of this massive open interest overhang significantly reduced short-term spot market selling pressure, paving the way for a relief rally.
Additionally, on-chain dynamics and liquidity conditions stabilized as the market completed a sweeping leverage flush. The preceding sell-off, which had triggered over one billion dollars in leveraged liquidations, effectively cleansed the market of speculative long positions. While persistent spot ETF outflows and strategic distribution by larger whale addresses had previously weighed on price action, the cleared leverage profile allowed organic spot demand to drive the price upward. This structural reset, supported by stablecoin inflows acting as fiat on-ramps, hints at a transition from panic-driven liquidations to a more stable consolidation phase.
Technical Analysis of Bitcoin (BTCUSD)
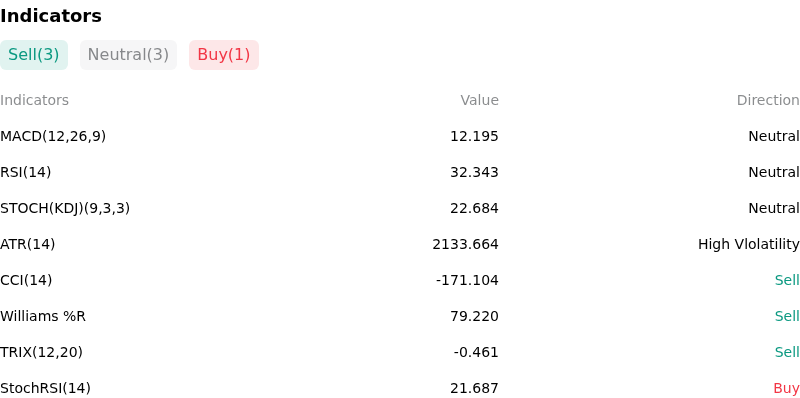
Technically, Bitcoin (BTCUSD) shows a MACD (12,26,9) value of 12.195, indicating a neutral signal. The RSI at 32.343 suggests neutral condition and the Williams %R at 79.220 suggests sell condition. Please monitor closely.
More details about Bitcoin (BTCUSD)
Recent Events and Risks:
- Massive $10 Billion Options Expiry: Approximately $10 billion in notional value of Bitcoin options is set to expire on Deribit on June 26, 2026. With the vast majority of these contracts consisting of bullish call options that have fallen out-of-the-money due to recent spot price declines, market participants are bracing for intense volatility as dealers unwind hedges and traders adopt defensive or outright bearish postures.
- Accelerating Institutional ETF Outflows: Selling pressure from U.S. spot Bitcoin ETFs has intensified, with the funds suffering $469.08 million in net outflows on June 24, 2026. This marked the fifth consecutive day of net redemptions, led by BlackRock's IBIT shedding $239.29 million, bringing total outflows for the month to nearly $3 billion and stripping the market of a primary source of spot demand.
- Technical Breakdown and Liquidation Cascades: Bitcoin broke below the critical psychological support level of $60,000 to tap a 21-month low of $58,115 on June 25, 2026. This technical breakdown triggered an immediate leverage flush, resulting in up to $1.48 billion in crypto-wide liquidations in a 24-hour period, which has depleted market depth and exacerbated downward spot momentum.
- Macro Headwinds from Hot Inflation Data: The U.S. Commerce Department's PCE price index accelerated to 4.1% on June 25, 2026, effectively dashing any lingering expectations for near-term Federal Reserve interest rate cuts. This sticky inflation, coupled with a surging U.S. dollar and elevated Treasury yields, is driving institutional risk-off capital rotation away from non-yielding digital assets.
This article may include AI-generated content that is human-reviewed, which is for reference and general information purposes only and does not constitute investment advice.
Recommended Articles


Comments (0)
Click the $ button, enter the symbol, and select to link a stock, ETF, or other ticker.