

Vertiv Holdings Co Stock (VRT) Moved Down by 5.27% on Apr 28: Key Drivers Unveiled

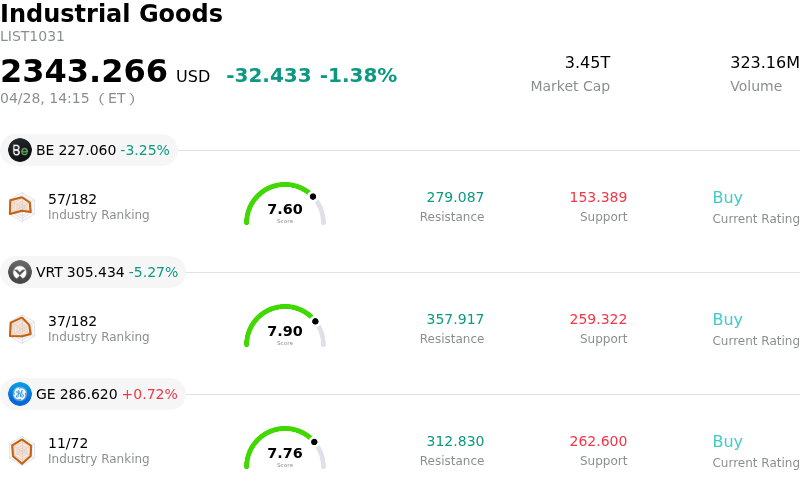
Vertiv Holdings Co (VRT) moved down by 5.27%. The Industrial Goods sector is down by 1.38%. The company underperformed the industry. Top 3 stocks by turnover in the sector: Bloom Energy Corp (BE) down 3.25%; Vertiv Holdings Co (VRT) down 5.27%; General Electric Co (GE) up 0.72%.
What is driving Vertiv Holdings Co (VRT)’s stock price down today?
Vertiv Holdings (VRT) experienced a notable decline in its share price today, influenced by a confluence of factors despite recent positive financial news. The downward movement appears to stem primarily from lingering investor concerns that emerged following the company's first-quarter 2026 earnings report last week.
While Vertiv reported strong first-quarter results, surpassing both earnings per share and revenue estimates, and subsequently raised its full-year 2026 guidance, specific aspects of the report likely contributed to today's selling pressure. Investors showed apprehension regarding softer demand in overseas markets, particularly in the EMEA region, and second-quarter earnings guidance that was perceived as slightly below some analyst expectations. These factors, alongside the stock's significant appreciation over the past year, could have prompted profit-taking.
Additionally, the disclosure of an institutional investor reducing its stake in Vertiv during the fourth quarter, even if representing past activity, may have impacted market sentiment on the day it was reported. Concerns about competitive risks, such as major customers potentially developing their own in-house solutions, also present an ongoing challenge for the company's future growth prospects, potentially fueling investor caution. The stock's high valuation, noted by some analysts, suggests it could be particularly susceptible to such concerns and contribute to volatility.
Technical Analysis of Vertiv Holdings Co (VRT)
Technically, Vertiv Holdings Co (VRT) shows a MACD (12,26,9) value of [14.93], indicating a buy signal. The RSI at 67.11 suggests neutral condition and the Williams %R at -13.82 suggests oversold condition. Please monitor closely.
Fundamental Analysis of Vertiv Holdings Co (VRT)
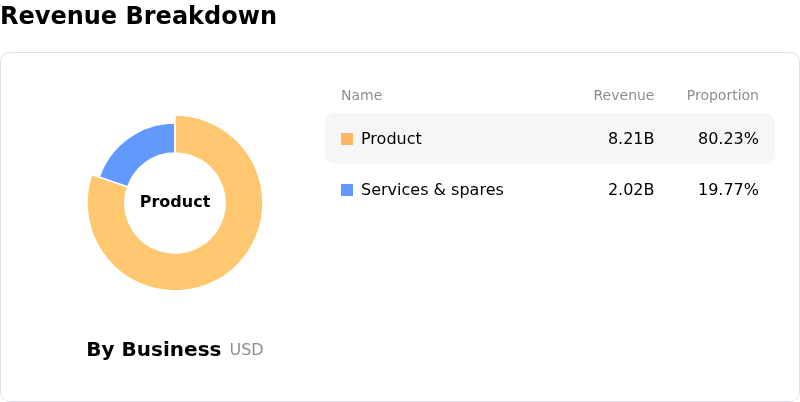
Vertiv Holdings Co (VRT) is in the Industrial Goods industry. Its latest annual revenue is $10.23B, ranking 17 in the industry. The net profit is $1.33B, ranking 13 in the industry. Company Profile
Over the past month, multiple analysts have rated the company as Buy, with an average price target of $315.51, a high of $380.00, and a low of $112.00.
More details about Vertiv Holdings Co (VRT)
Company Specific Risks:
- Near-term demand concerns in overseas markets, particularly Europe, the Middle East, and Africa, led to a 20% decline in revenue for the region and contributed to post-earnings stock weakness.
- The Q2 EPS guidance (1.370–1.430) fell marginally below some street expectations (~1.44), triggering profit-taking and contributing to intraday volatility despite a strong Q1 performance.
- Management's decision not to disclose the Q1 backlog figure has raised concerns about demand visibility, signaling a potential yellow flag for investors focused on future order certainty.
- Sizable insider selling, exceeding $100 million over the past year, alongside elevated put option activity, indicates potential lack of near-term conviction from insiders and traders hedging against further downside.
This article may include AI-generated content that is human-reviewed, which is for reference and general information purposes only and does not constitute investment advice.
Recommended Articles


Comments (0)
Click the $ button, enter the symbol, and select to link a stock, ETF, or other ticker.