

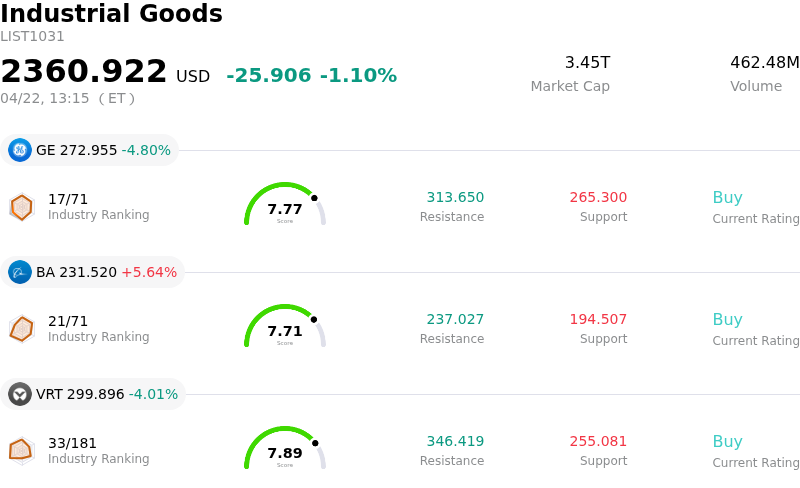
Vertiv Holdings Co Stock (VRT) Moved Down by 4.01% on Apr 22: Facts Behind the Movement

Vertiv Holdings Co (VRT) moved down by 4.01%. The Industrial Goods sector is down by 1.10%. The company underperformed the industry. Top 3 stocks by turnover in the sector: General Electric Co (GE) down 4.80%; Boeing Co (BA) up 5.64%; Vertiv Holdings Co (VRT) down 4.01%.
What is driving Vertiv Holdings Co (VRT)’s stock price down today?
VRT's stock experienced a decline today, primarily influenced by investor reaction to the company's first-quarter 2026 earnings report and forward-looking guidance. While the company reported strong first-quarter financial results, surpassing analyst expectations for both earnings per share and revenue, the market's focus shifted to certain aspects of its future outlook.
A key factor contributing to the negative sentiment was the guidance provided for the second quarter and the full fiscal year 2026. Despite the company raising its full-year earnings per share outlook, the midpoint of its second-quarter revenue guidance, and to some extent the full-year revenue guidance, were perceived by investors as falling short of elevated expectations. This suggests that while the company's performance remains robust, the bar for growth in the AI infrastructure sector is particularly high, leading to a pull back when guidance doesn't provide a substantial beat.
Additionally, the earnings report highlighted a notable weakness in sales within the Europe, Middle East, and Africa (EMEA) region, where revenue declined significantly compared to the prior year. This regional underperformance contrasted with strong growth observed in the Americas and likely introduced concerns about uneven global demand trends or potential project timing shifts, dampening overall investor enthusiasm despite the robust demand for data center infrastructure worldwide. Recent insider selling activity was also noted, which could have contributed to investor caution.
Technical Analysis of Vertiv Holdings Co (VRT)
Technically, Vertiv Holdings Co (VRT) shows a MACD (12,26,9) value of [12.73], indicating a buy signal. The RSI at 66.35 suggests neutral condition and the Williams %R at -14.11 suggests oversold condition. Please monitor closely.
Fundamental Analysis of Vertiv Holdings Co (VRT)
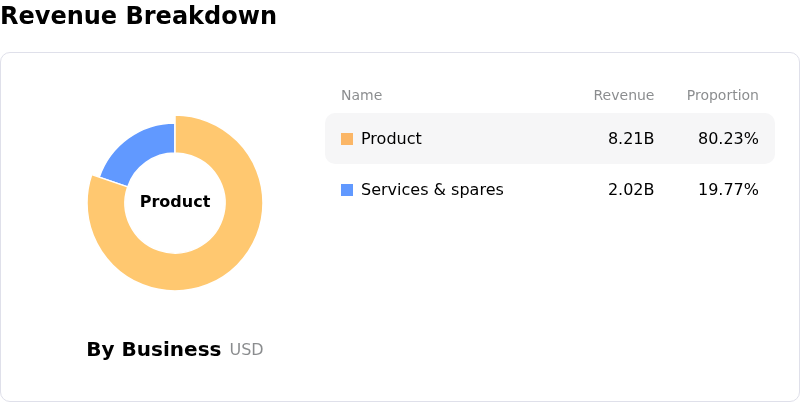
Vertiv Holdings Co (VRT) is in the Industrial Goods industry. Its latest annual revenue is $10.23B, ranking 17 in the industry. The net profit is $1.33B, ranking 13 in the industry. Company Profile
Over the past month, multiple analysts have rated the company as Buy, with an average price target of $280.88, a high of $345.00, and a low of $112.00.
More details about Vertiv Holdings Co (VRT)
Company Specific Risks:
- Vertiv's second-quarter guidance implies a sequential deceleration in organic sales growth compared to strong prior-year comparisons, with analyst commentary suggesting the full-year guidance raise was less than anticipated by some bulls, potentially leading to downward pressure on the stock.
- Concerns regarding potential overvaluation persist, with InvestingPro analysis indicating shares may be overvalued and Simply Wall St estimating the stock is approximately 20.2% above its fair value.
- Macroeconomic concerns and signals of a potential global slowdown are being factored in by investors, which could temper future demand and growth expectations for Vertiv.
- Despite strong demand, the company faces potential limitations to margin expansion due to the increasing costs associated with scaling up production capacity to meet high order volumes.
This article may include AI-generated content that is human-reviewed, which is for reference and general information purposes only and does not constitute investment advice.
Recommended Articles


Comments (0)
Click the $ button, enter the symbol, and select to link a stock, ETF, or other ticker.