


USD/CAD Price Forecast: Eyes 1.4000 support after slipping below 50-day EMA



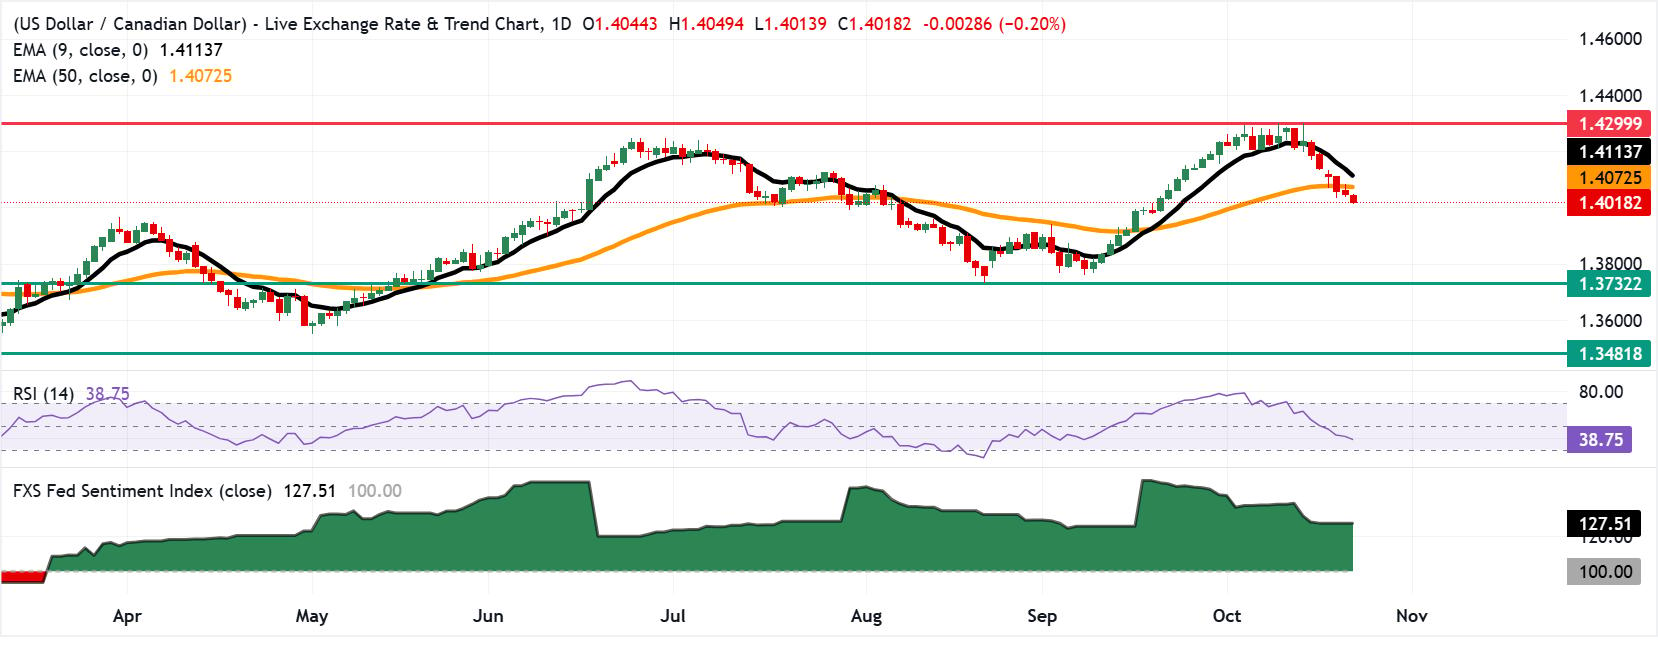
- USD/CAD may fall toward the five-month low of 1.3732.
- The 14-day Relative Strength Index of 39 suggests persistent downside pressure.
- The primary barrier lies at the 50-day EMA of 1.4072.
USD/CAD continues its losing streak for the sixth successive day, trading around 1.4020 during European hours on Thursday. The pair is retaining a bearish near-term bias as it holds beneath both the 50- and nine-day Exponential Moving Averages (EMAs).
The USD/CAD pair has pulled back from recent highs while the 14-day Relative Strength Index (RSI) at about 39 slides toward oversold territory, which hints at persistent downside pressure rather than an imminent reversal, even as the FXS Fed Sentiment Index cools from prior extremes.
On the downside, the USD/CAD pair may navigate the region around the five-month low of 1.3732, recorded on May 21. Further support lies at 1.3481, the lowest since October 2024.
The USD/CAD pair may rebound and test the initial resistance at the 50-day EMA of 1.4072, followed by the nine-day EMA of 1.4113. Further advances above these moving averages would support the pair to test the 18-month high of 1.4299, recorded on October 14.
USD/CAD under pressure as IMF highlights widening North American growth gap
Strategists at Societe Generale flag that the latest IMF projections underscore a growing divergence in North American growth prospects, noting that “with the IMF’s US growth forecast revised up to 2.5% this year (while remaining at 2.1% in 2027), the North American growth gap is widening.” They point out that while “the chart on the right shows relative Bloomberg consensus growth forecasts for 2027,” the IMF’s own assessment is “even less favourable for Canada,” with “1.2% growth in Canada next year versus 2.1% in the US.” At the same time, they highlight that “the chart on the left shows the two-year rate differential plotted against USD/CAD,” underlining how relative growth expectations and short-end spreads continue to frame the Canadian Dollar’s performance against the US Dollar.
(The technical analysis of this story was written with the help of an AI tool. Know more.)
Canadian Dollar Price Today
The table below shows the percentage change of Canadian Dollar (CAD) against listed major currencies today. Canadian Dollar was the strongest against the New Zealand Dollar.
| USD | EUR | GBP | JPY | CAD | AUD | NZD | CHF | |
|---|---|---|---|---|---|---|---|---|
| USD | -0.05% | -0.09% | -0.75% | -0.21% | 0.18% | 0.23% | -0.59% | |
| EUR | 0.05% | -0.06% | -0.72% | -0.20% | 0.23% | 0.28% | -0.56% | |
| GBP | 0.09% | 0.06% | -0.65% | -0.15% | 0.27% | 0.32% | -0.50% | |
| JPY | 0.75% | 0.72% | 0.65% | 0.52% | 0.93% | 0.95% | 0.15% | |
| CAD | 0.21% | 0.20% | 0.15% | -0.52% | 0.40% | 0.47% | -0.37% | |
| AUD | -0.18% | -0.23% | -0.27% | -0.93% | -0.40% | 0.04% | -0.77% | |
| NZD | -0.23% | -0.28% | -0.32% | -0.95% | -0.47% | -0.04% | -0.79% | |
| CHF | 0.59% | 0.56% | 0.50% | -0.15% | 0.37% | 0.77% | 0.79% |
The heat map shows percentage changes of major currencies against each other. The base currency is picked from the left column, while the quote currency is picked from the top row. For example, if you pick the Canadian Dollar from the left column and move along the horizontal line to the US Dollar, the percentage change displayed in the box will represent CAD (base)/USD (quote).
Recommended Articles









Comments (0)
Click the $ button, enter the symbol, and select to link a stock, ETF, or other ticker.