


British Pound rallies as soft US PPI hits US Dollar



- US PPI cools more than expected, pressuring Dollar broadly.
- Oil rebound keeps inflation risks alive despite June disinflation.
- Burnham transition and EU hopes support Sterling sentiment.
The Pound Sterling rises by some 0.60% against the US Dollar after the latest Producer Price Index (PPI) in the US showed prices edging lower, driven by the dip in energy prices since late May. At the time of writing, the GBP/USD trades at 1.3460 after bouncing off a daily low of 1.3370.
GBP/USD rises as softer US prices trim Fed hike bets
The US Bureau of Labour Statistics (BLS) reported that the PPI in June fell from 6% to 5.5% YoY, below estimates of a 6.2% increase. Excluding volatile items, the so-called Core PPI also slowed from 4.6% to 4.7% YoY, beneath forecasts of 5.2%.
The US-Iran signing the Memorandum of Understanding (MoU), weighed on energy prices as Western Texas Intermediate (WTI) dipped from around $97 early in June to $68 by the end of the last month, for a 30% plunge.
However, the escalation of the Middle East conflict. could trigger a leg up in inflation, as WTI has risen nearly 15% to $80 since reaching the $68 barrier by the end of June.
In the meantime, the Fed Chair Kevin Warsh is crossing the wires. HE said the surge in prices is also driven by AI, adding that he can’t guarantee there won't be short-term disruptions due to its influence.
Earlier, the New York Fed President John Williams said that there’s no clear direction for the path of interest rates, adding that economic growth is solid, as well as the labor market. Williams commented that the Middle East conflict poses “significant risks” that so far the US economy has absorbed” fairly well.
Across the pond, uncertainty and tensions over UK politics eased, a tailwind for Sterling, which continues to climb towards 1.3500. Speculation that Britain could close ties with the European Union is another reason behind the GBP/USD rise.
Andy Burnham is expected to be announced as Labour leader on Friday and named prime minister on July 20, shifting focus to his finance minister choice amid the nation's shaky public finances.
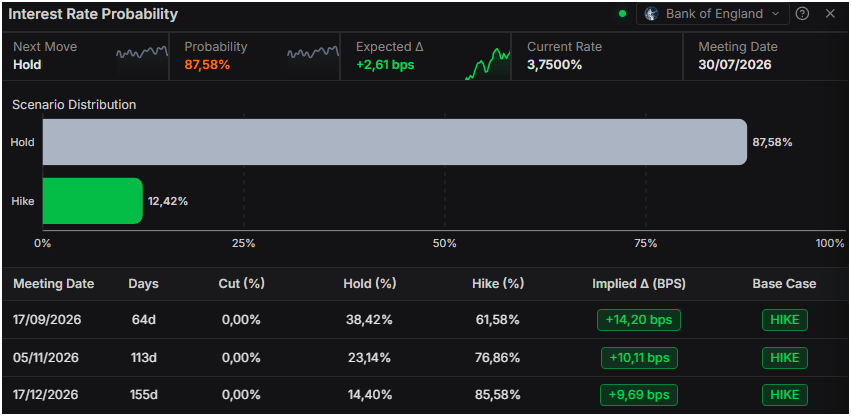
Regarding interest rates, money markets had priced in 36 basis points (bps) of tightening by the Bank of England (BoE), towards the end of the year. For the July 30 meeting, the odds for holding rats are 87%, according to Prime Terminal data.
GBP/USD Price Forecast: Technical outlook
In the daily chart, GBP/USD trades at 1.3487, maintaining a bullish near-term bias as spot holds above the cluster of simple moving averages (SMA) around 1.3385 and the rising trend-line base near 1.3159. Price is now pressing the downward resistance trend line at 1.3492, while the Relative Strength Index (14) at 63 suggests firm but not yet overbought momentum, reinforced by a still-elevated FXS Fed Sentiment Index, which hints at supportive macro backdrop for sterling in the short term.
On the topside, immediate resistance is located at the descending trend-line break level around 1.3492, where a clear daily close above would open the way for a continuation of the advance. On the downside, initial support is seen at the latest price floor near 1.3487, followed by the grouped daily SMAs around 1.3385, with the broader bullish structure anchored by the upward trend-line origin near 1.3159 as deeper support.
(The technical analysis of this story was written with the help of an AI tool. Know more.)
Pound Sterling Price This week
The table below shows the percentage change of British Pound (GBP) against listed major currencies this week. British Pound was the strongest against the Japanese Yen.
| USD | EUR | GBP | JPY | CAD | AUD | NZD | CHF | |
|---|---|---|---|---|---|---|---|---|
| USD | -0.26% | -0.72% | 0.21% | -0.76% | -0.77% | -1.31% | -0.11% | |
| EUR | 0.26% | -0.46% | 0.52% | -0.51% | -0.55% | -1.06% | 0.15% | |
| GBP | 0.72% | 0.46% | 0.94% | -0.05% | -0.09% | -0.61% | 0.66% | |
| JPY | -0.21% | -0.52% | -0.94% | -1.05% | -0.99% | -1.57% | -0.37% | |
| CAD | 0.76% | 0.51% | 0.05% | 1.05% | 0.07% | -0.52% | 0.70% | |
| AUD | 0.77% | 0.55% | 0.09% | 0.99% | -0.07% | -0.51% | 0.62% | |
| NZD | 1.31% | 1.06% | 0.61% | 1.57% | 0.52% | 0.51% | 1.27% | |
| CHF | 0.11% | -0.15% | -0.66% | 0.37% | -0.70% | -0.62% | -1.27% |
The heat map shows percentage changes of major currencies against each other. The base currency is picked from the left column, while the quote currency is picked from the top row. For example, if you pick the British Pound from the left column and move along the horizontal line to the US Dollar, the percentage change displayed in the box will represent GBP (base)/USD (quote).
Recommended Articles







Comments (0)
Click the $ button, enter the symbol, and select to link a stock, ETF, or other ticker.