


USD/CHF Price Forecast: Consolidates gains above 0.8130 with US CPI, Fed Warsh in focus



- USD/CHF consolidates above 08i30 after hitting fresh YTD highs in the 0.8150 area.
- US CPI is expected to confirm that inflation remained well above the Fed's target in June.
- The US Dollar is on a bullish trend, aiming for the 0.8170 area.
The US Dollar (USD) is trading practically flat against the Swiss Franc (CHF) on Tuesday, consolidating gains after a 0.7% rally on Monday, boosted by rising geopolitical tensions and hawkish Comments by Federal Reserve (Fed) Governor Christopher Waller.
Waller said on Monday that the Fed would have to tighten its monetary policy in the near-term if inflation remains above the 2% target. Investors brought forward rate hike bets, following Waller's comments, and sent the US Dollar higher across the board.
The focus on Tuesday is on June’s US Consumer Price Index (CPI), which is highly likely to confirm Waller’s expectations with figures well beyond target. These data are likely to frame the first session of Fed Chairman Kevin Warsh’s testimony before Congress, which is due later on the day. The risk is skewed to the upside for the US Dollar.
Technical Anañysis: The next bullish target is the 0.8170 area
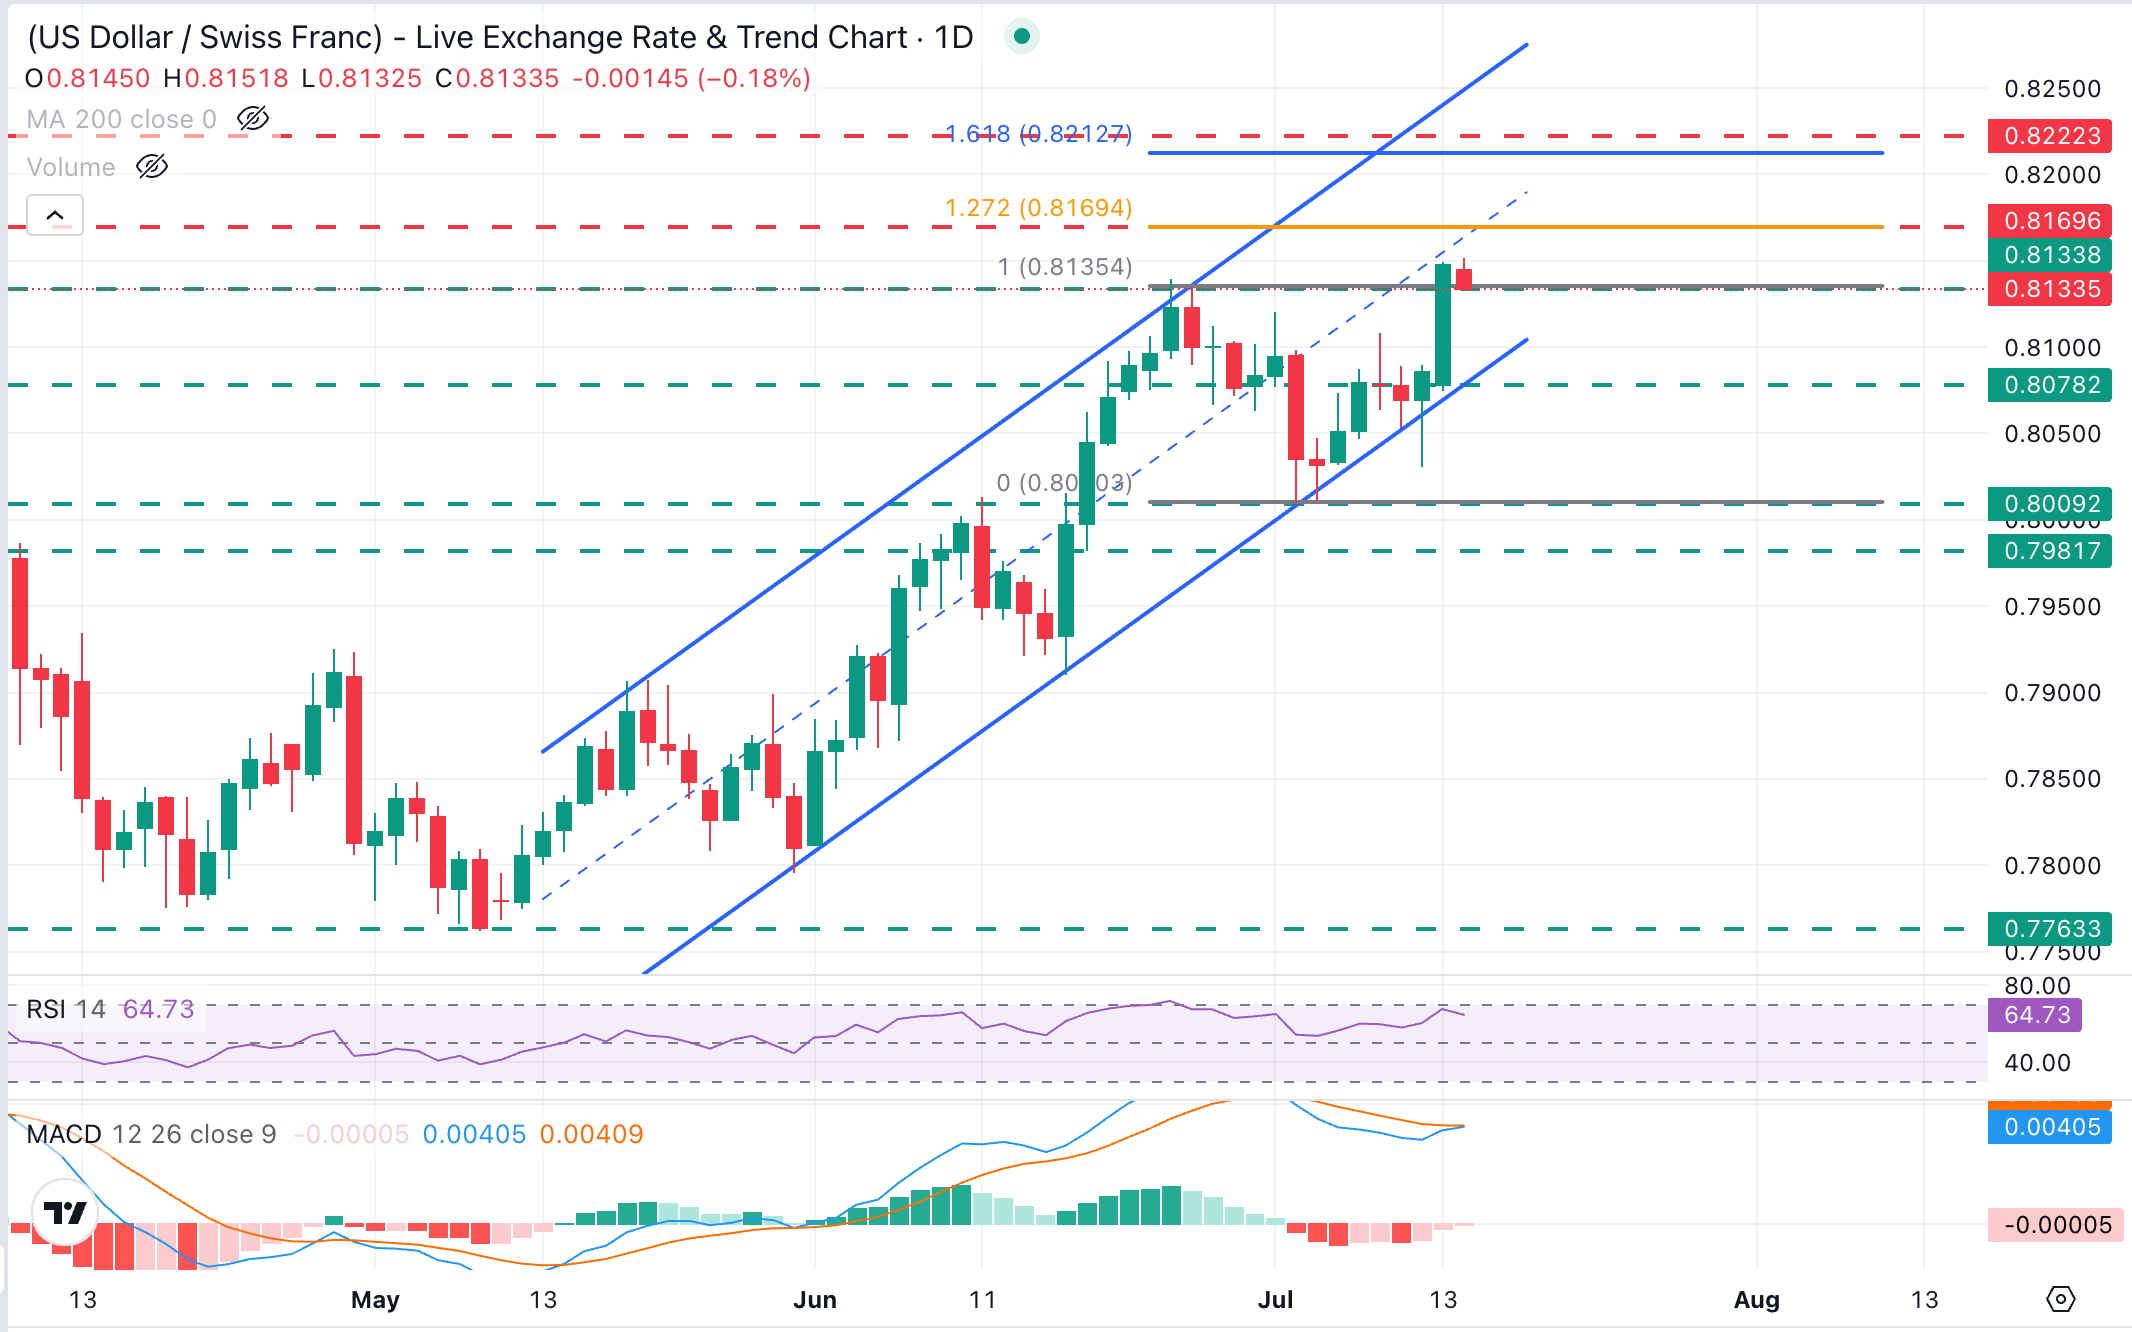
USD/CHF broke the year-to-date high at 0.8130, confirming that the corrective reaction of the last two weeks has been completed, with the impulsive candle on the daily chart suggesting that bulls have taken control. Momentum indicators support this view, with the 14-day Relative Strength Index (RSI) in positive territory without yet reaching extreme overbought levels, and the Moving Average Convergence Divergence (MACD) line attempting to cross the Signal line, which is a bullish sign.
Immediate resistance is at the mentioned high, at 0.8150, although the confluence of the July 2025 top and the 127.2% Fibonacci retracement of the late June-early July reversal, at 0.8170, seems a more plausible target. Further up, the 161.8% Fibonacci retracement of the mentioned cycle is at 0.8210.
A confirmation below the previous YTD high, in the 0.8130 area, is likely to find support at the 0.8070-0.8080 area, where the bottom of the ascending channel from early June lows meets Monday's lows. Below here, bullish momentum would fade, and the July 2 low, near 0.8010, would return to the focus.
(The technical analysis of this story was written with the help of an AI tool. Know more.)
US Dollar Price This week
The table below shows the percentage change of US Dollar (USD) against listed major currencies this week. US Dollar was the strongest against the Swiss Franc.
| USD | EUR | GBP | JPY | CAD | AUD | NZD | CHF | |
|---|---|---|---|---|---|---|---|---|
| USD | 0.04% | 0.23% | 0.36% | -0.39% | 0.10% | -0.55% | 0.69% | |
| EUR | -0.04% | 0.18% | 0.33% | -0.44% | 0.01% | -0.60% | 0.65% | |
| GBP | -0.23% | -0.18% | 0.11% | -0.61% | -0.17% | -0.77% | 0.51% | |
| JPY | -0.36% | -0.33% | -0.11% | -0.82% | -0.26% | -0.95% | 0.28% | |
| CAD | 0.39% | 0.44% | 0.61% | 0.82% | 0.57% | -0.12% | 1.13% | |
| AUD | -0.10% | -0.01% | 0.17% | 0.26% | -0.57% | -0.61% | 0.54% | |
| NZD | 0.55% | 0.60% | 0.77% | 0.95% | 0.12% | 0.61% | 1.30% | |
| CHF | -0.69% | -0.65% | -0.51% | -0.28% | -1.13% | -0.54% | -1.30% |
The heat map shows percentage changes of major currencies against each other. The base currency is picked from the left column, while the quote currency is picked from the top row. For example, if you pick the US Dollar from the left column and move along the horizontal line to the Japanese Yen, the percentage change displayed in the box will represent USD (base)/JPY (quote).
Recommended Articles







Comments (0)
Click the $ button, enter the symbol, and select to link a stock, ETF, or other ticker.