


Official Trump Price Forecast: TRUMP hits record low amid mounting selling pressure



- Official Trump token hovers near $1.25 on Thursday, following a 20% decline the previous day.
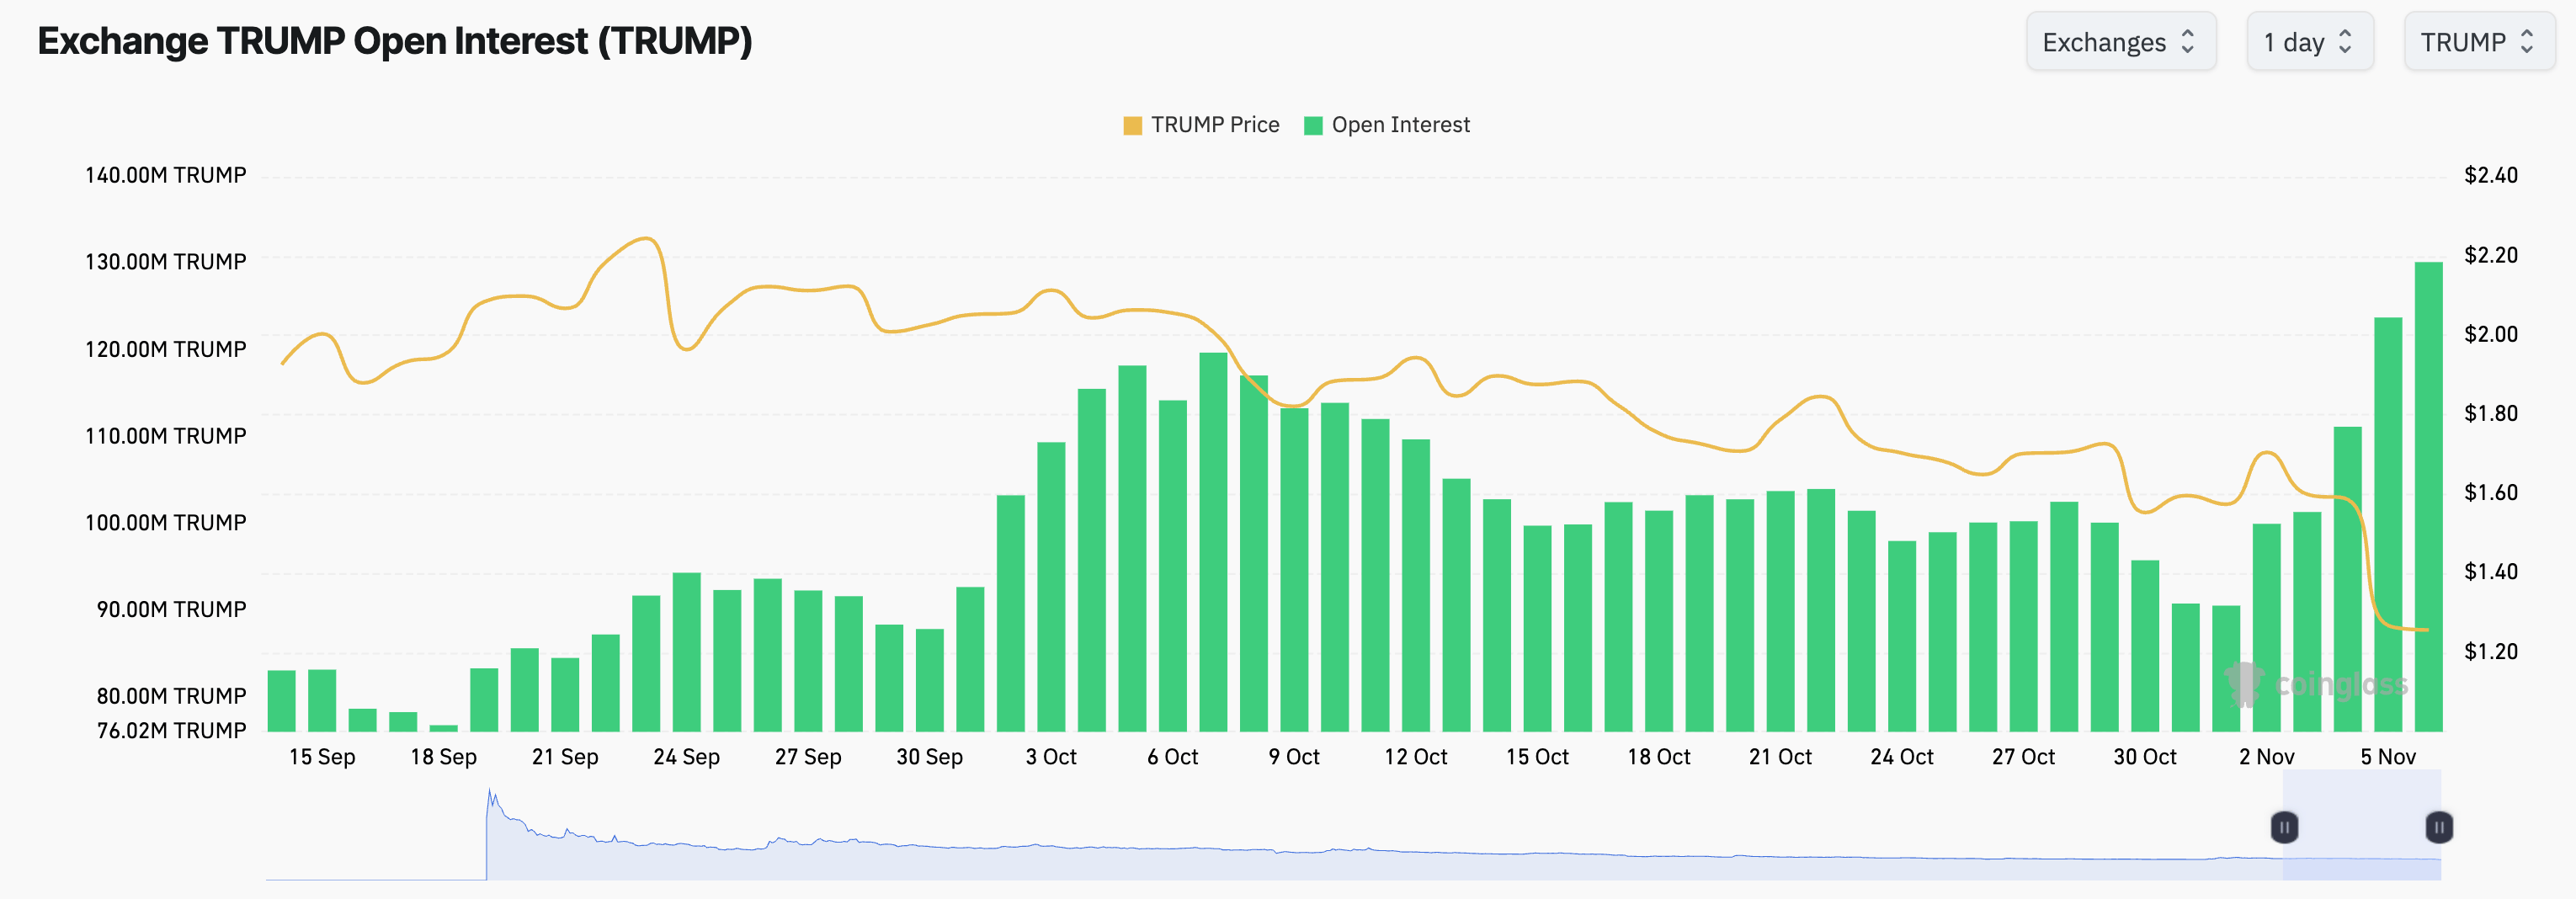
- TRUMP Open Interest shows a steady recovery so far this week, while spot prices have declined, implying a bearish positional buildup.
- The technical outlook for TRUMP suggests a downside bias as selling pressure mounts.
Official Trump (TRUMP) hovers around $1.2500 at press time on Thursday, taking a breather after a 20% drop the previous day. TRUMP token’s decline aligns with Republicans' defeat in the US midterms. Positional buildup in TRUMP derivatives suggests a more bearish bias among traders, while the technical outlook reaffirms the potential for further downside as selling pressure persists.
Fresh short positions enter TRUMP futures
TRUMP derivatives have seen a surge in capital inflows, leading to a positional buildup so far this week. According to CoinGlass, TRUMP Open Interest (OI) stands at 130 million TRUMP tokens, up from 100 million on Sunday, suggesting increased leveraged positioning. The renewed speculative interest in the token, amid a declining spot price, suggests a bearish bias.
Technical outlook: Can TRUMP avoid further losses?
TRUMP trades at a record low near $1.2580 on Thursday, continuing its downward trend over the last two months. The token also trades well below the 50- and 200-day Exponential Moving Averages (EMAs) at $1.7806 and $2.3075, respectively, maintaining a bearish near-term bias.
From a technical perspective, TRUMP remains capped below a long-term resistance trendline connecting the August 29 and November 1 highs near $1.7772, and has sustained daily closes below the previous record low of $1.3650, set on August 13. This opens the path to further weakness, likely toward the $1.0000 psychological threshold.
Momentum remains weak, with the Moving Average Convergence Divergence (MACD) below zero and the signal line, and the Relative Strength Index (RSI) at 27 in the oversold zone, suggesting persistent downside pressure.
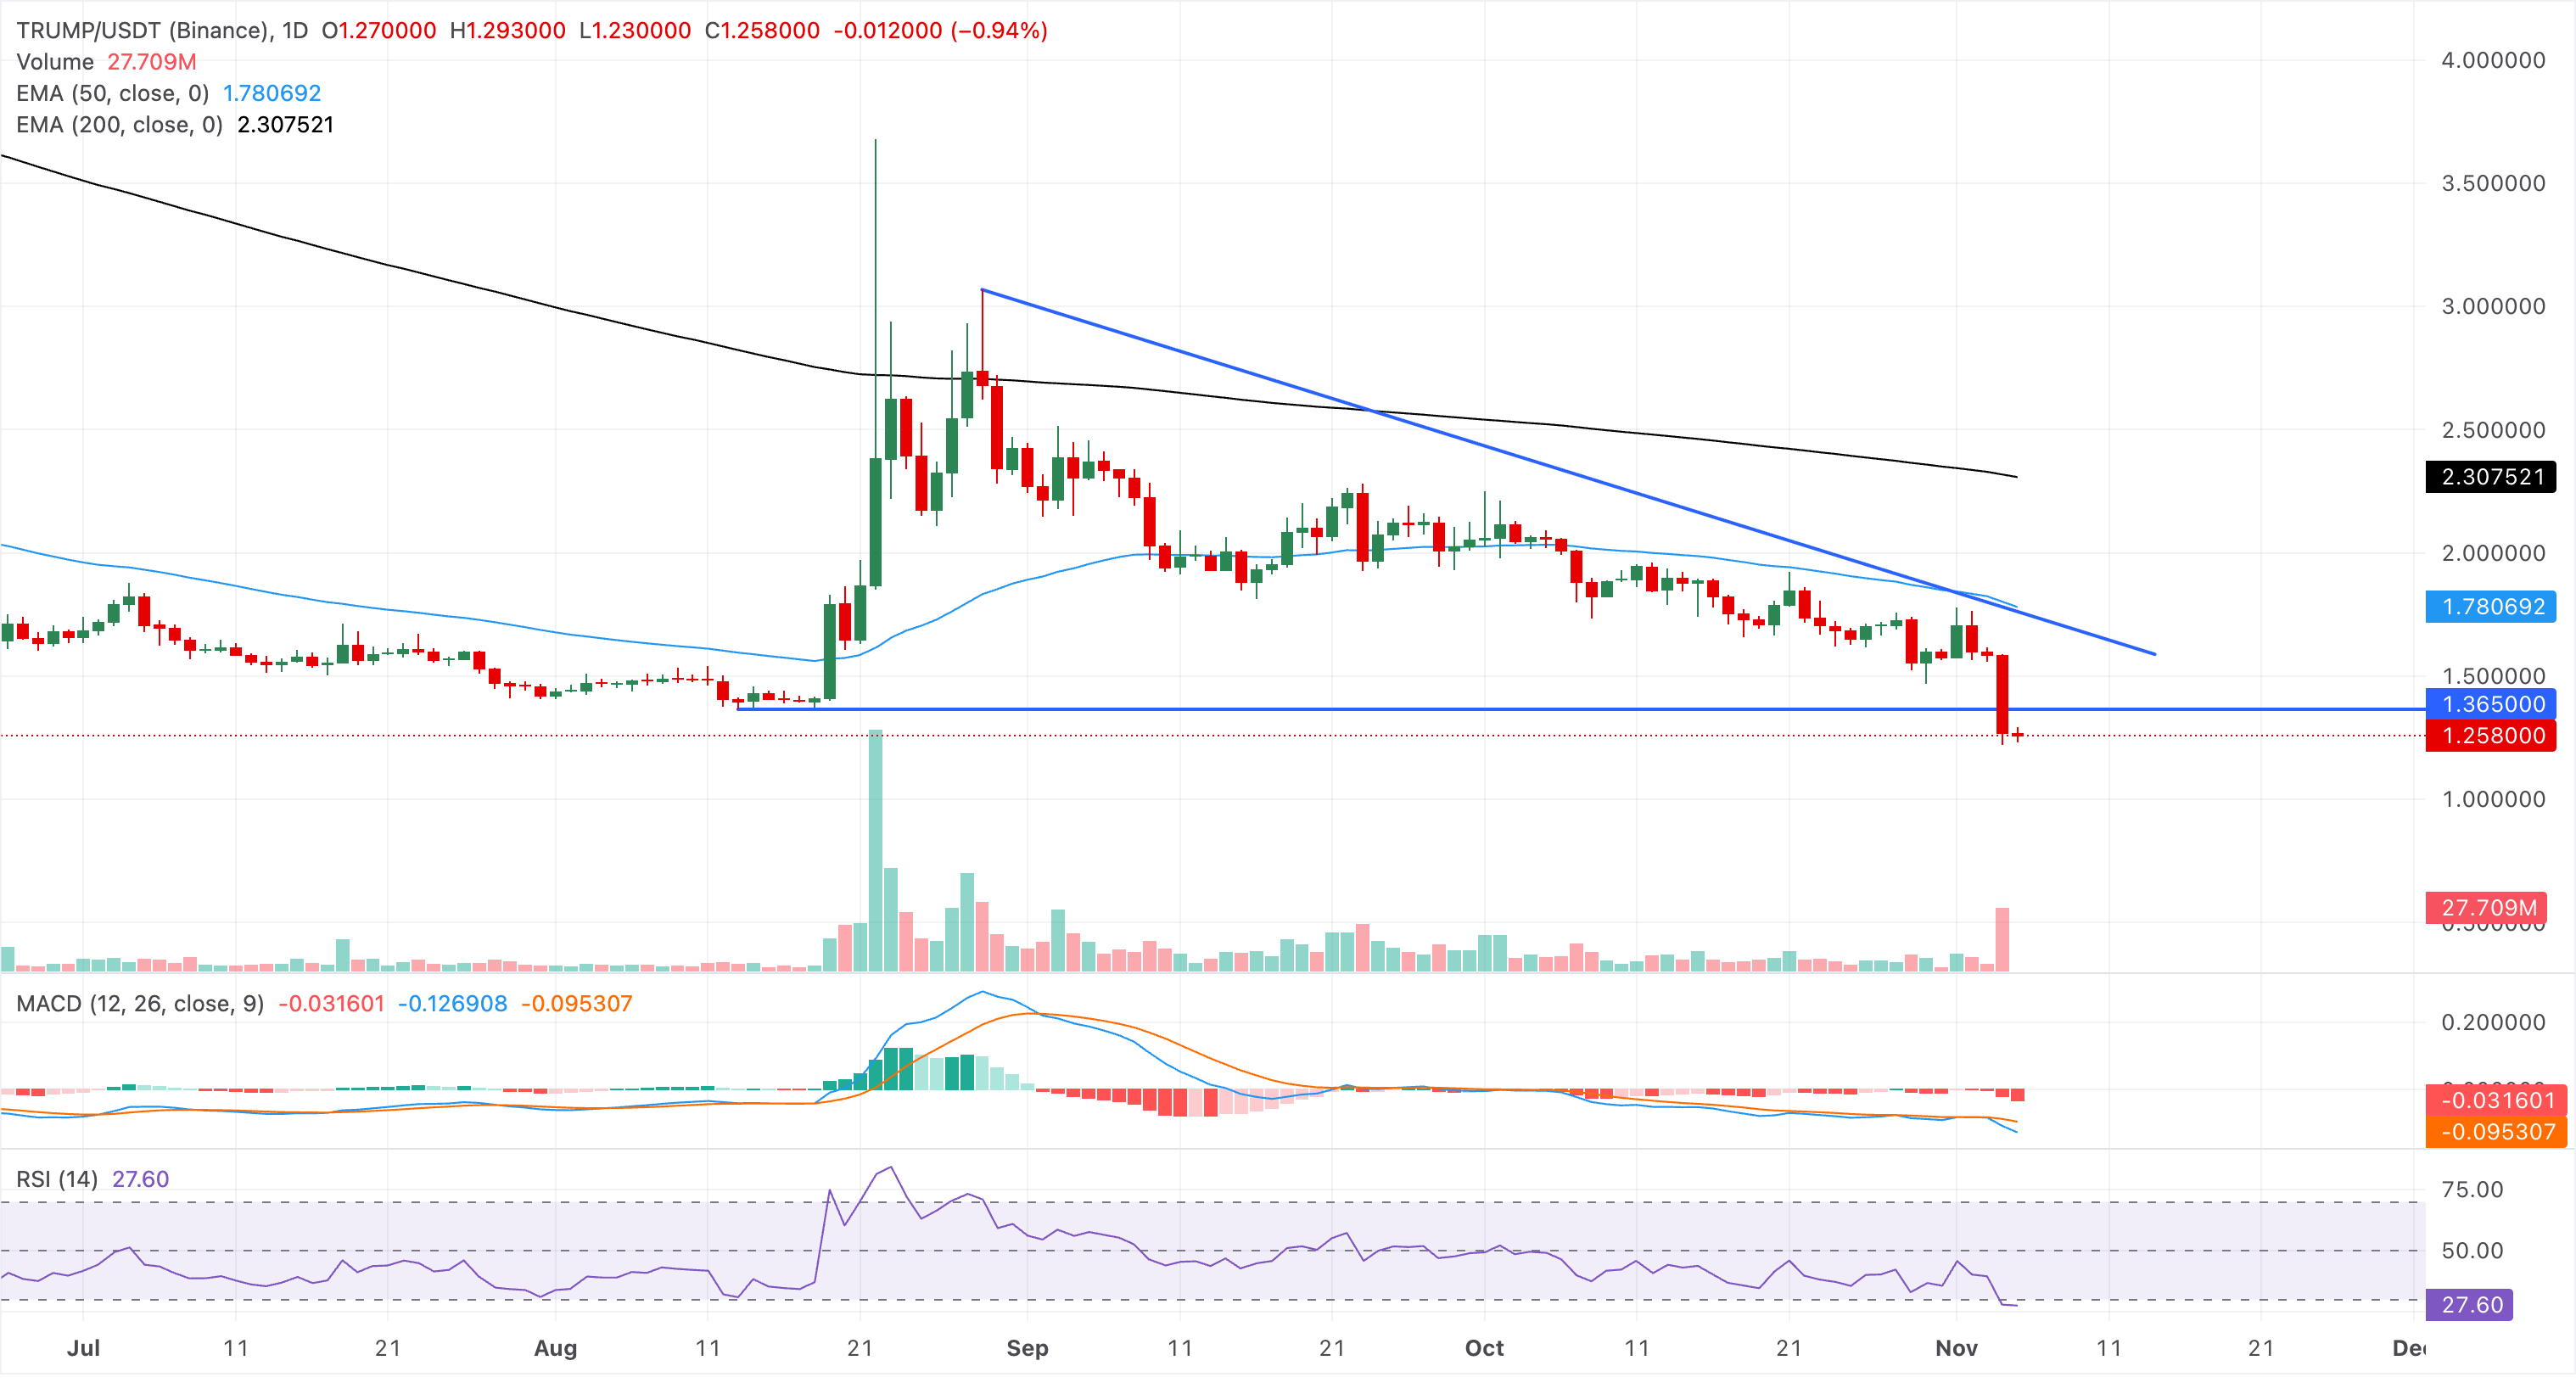
On the topside, initial resistance is observed at the descending trendline around $1.7772, reinforced by the 50-day EMA at $1.7806. A sustained move above these levels would be needed to ease the current bearish tone, with the 200-day EMA at $2.3075 acting as a much higher structural barrier.
(The technical analysis of this story was written with the help of an AI tool. Know more.)
Recommended Articles








Comments (0)
Click the $ button, enter the symbol, and select to link a stock, ETF, or other ticker.