


Zcash Price Forecast: $30 million ETF outflows weigh on mild ZEC recovery



- Zcash holds steady around $1,275 on Monday, after three consecutive daily bullish closes, including a 4% rise the previous day.
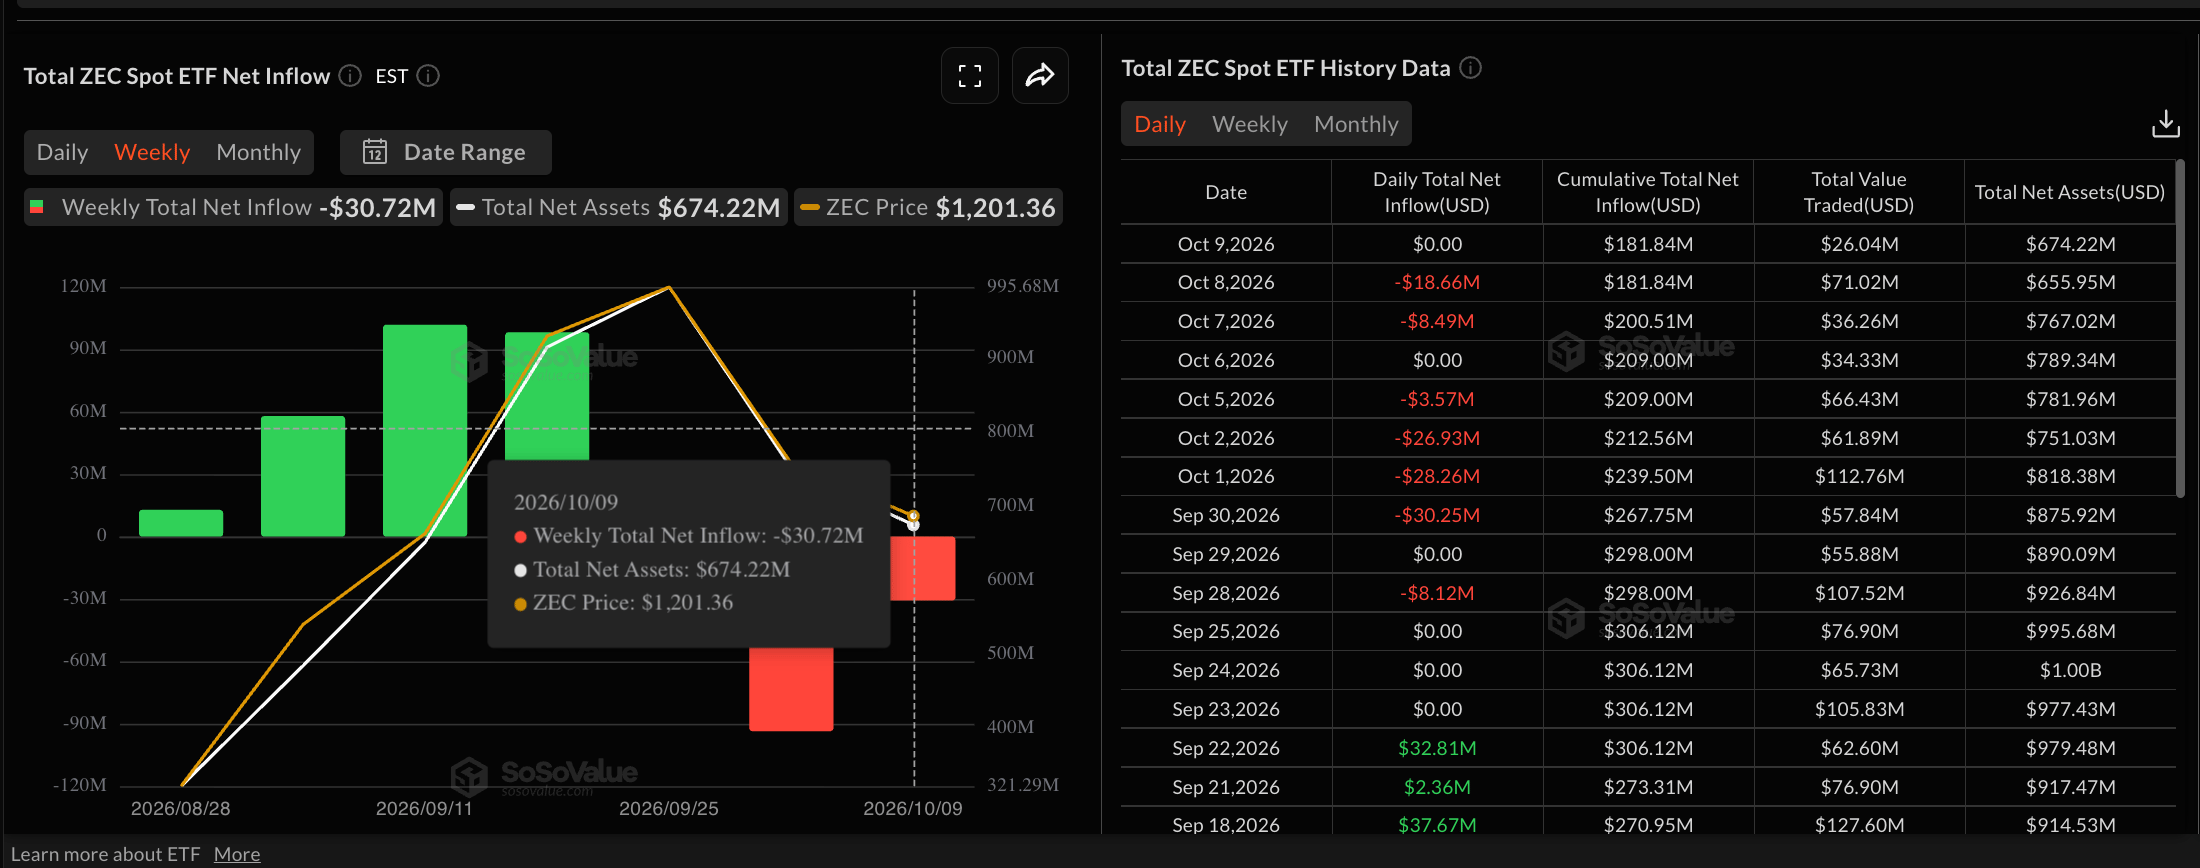
- Grayscale’s ZCSH ETF recorded $30 million in outflows last week, down from $93 million, suggesting easing institutional demand.
- The technical outlook for ZEC points to a lingering downside risk with a Death Cross emerging on the 4-hour chart.
Zcash (ZEC) trades around $1,278 at press time on Monday, holding the previous day's 4% gains and showing a steady recovery over the last three days. Institutional demand for Zcash remains low, with Grayscale’s ZEC-focused Exchange Traded Fund (ETF) recording $30 million in outflows last week. Zcash remains capped below the 50- and 200-period Exponential Moving Averages (EMAs) on the four-hour chart, risking a bearish reversal toward $1,050.
Grayscale’s ZCSH records over $30 million in investor redemptions
Grayscale’s ZEC-focused ETF (ZCSH) is facing near-term selling pressure. SoSoValue data shows $30.72 million in outflows last week, down from $93.56 million the previous week. The consistent outflows over the past two weeks reflect reduced demand for privacy coins, as investors continue to redeem their ZCSH ETF shares at large, likely driven by last month's 3-for-1 stock split.
Technical outlook: Zcash remains capped below $1,300 as over 15% downside risk lingers
Zcash consolidates below its 50- and 200-period EMAs on the four-hour chart near $1,279 and $1,274, respectively, after three consecutive days of recovery. This indicates a shift in the near-term bias toward a broadly neutral stance, away from the prevailing corrective tone.
The declining 50-period EMA is on the verge of crossing below the 200-period EMA, which could confirm a Death Cross pattern. The overhead EMAs continue to cap recovery attempts, reinforced by the September 9 high around $1,296. A confirmed breakout above this zone could nullify the downside risk, extending the recovery toward the $1,422 level set by the September 18 low.
Momentum is more constructive on the four-hour chart, with the Relative Strength Index (RSI) hovering around 58 above its midline, and the Moving Average Convergence Divergence (MACD) rising with its signal line, suggesting buyers are attempting to regain control.
Looking down, a bearish turnaround from the overhead EMAs could result in a lower-leg formation, targeting the $1,050 support level, marked by the September 4 high.
(The technical analysis of this story was written with the help of an AI tool. Know more.)
Recommended Articles









Comments (0)
Click the $ button, enter the symbol, and select to link a stock, ETF, or other ticker.