


Top Altcoins Price Forecast: Ripple, Cardano, Solana – Mild recovery signals further upside potential



- Ripple edges above $1.50 on Tuesday, ticking higher after three consecutive days of losses.
- Cardano is up nearly 3%, holding above its 200-day EMA at $0.2420 as bulls test the overhead line breakout.
- Solana hovers around $120, recovering after a 2% decline the previous day as momentum seems stretched.
Ripple (XRP), Cardano (ADA), and Solana (SOL) are trading in the green on Tuesday, recovering after a bearish start to the week. The mild recovery in Ripple and Solana aligns with steady institutional demand, while Cardano prepares for a potential bullish breakout of an overhead trendline. The technical outlook for XRP, ADA, and SOL is bullish, as the altcoins continue to sustain an upward trend for nearly two months.
Ripple and Solana ETFs record steady inflows
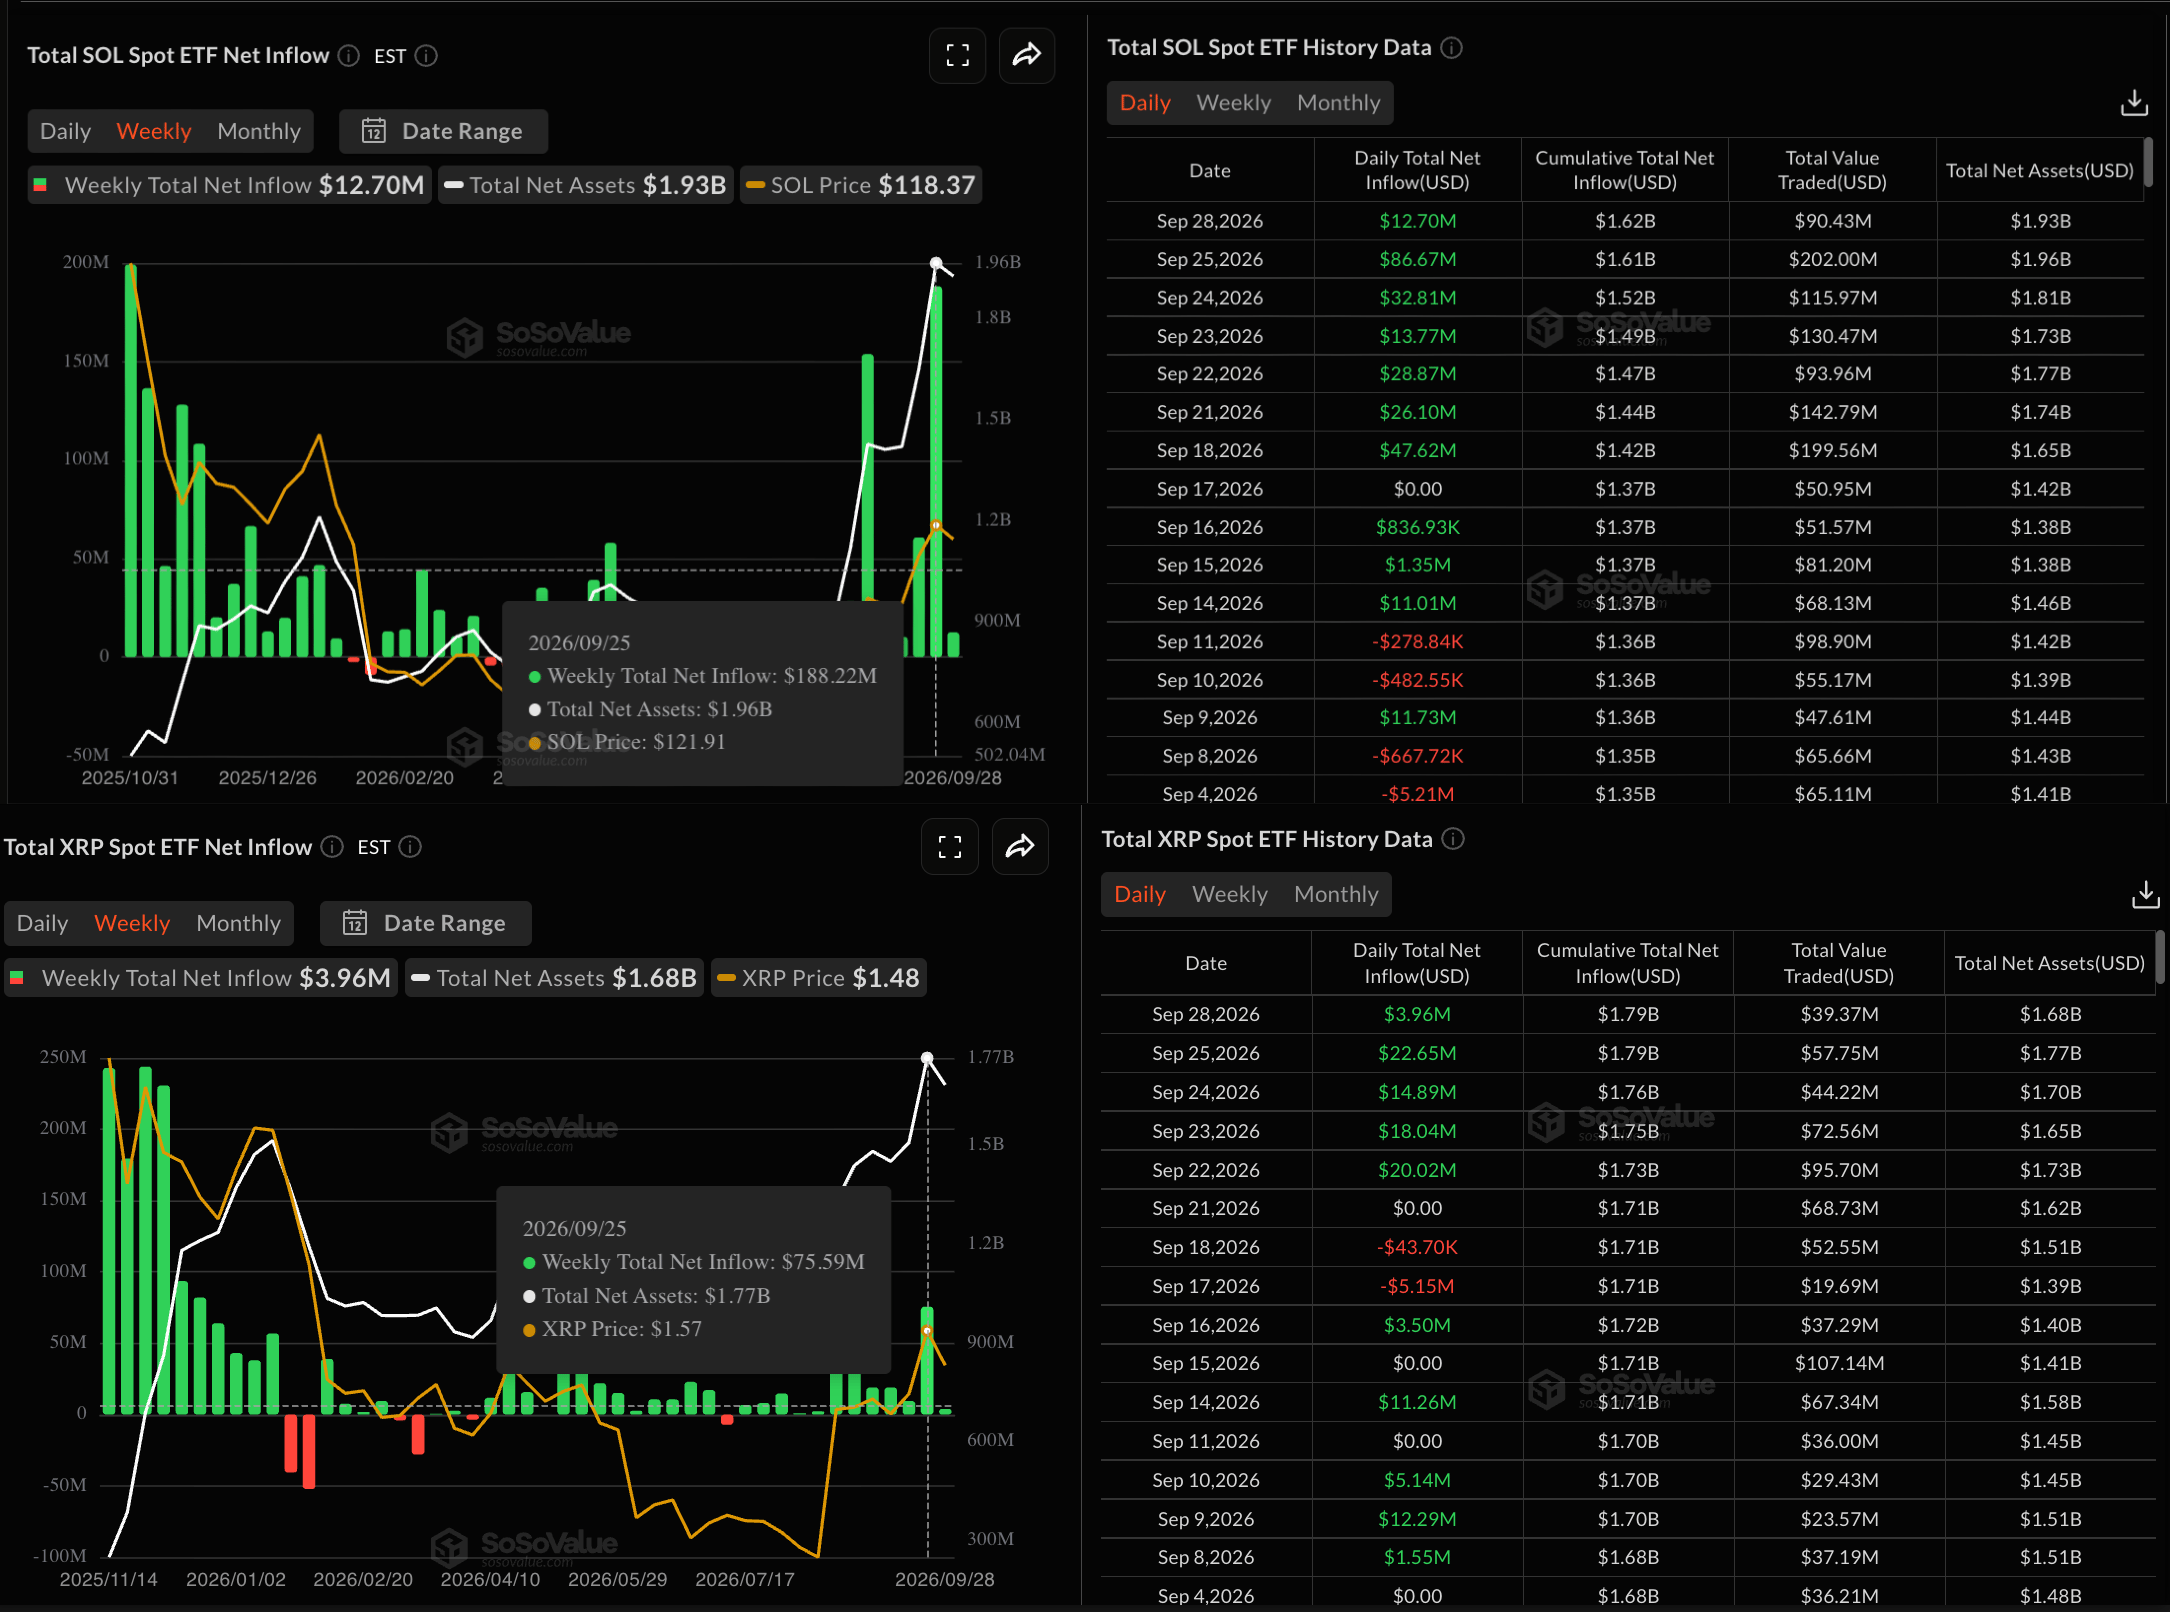
Ripple-focused ETFs recorded $3.96 million in inflows on Monday, marking their fifth consecutive day of positive inflows. The institutional demand for Ripple remains firm, following the $75.59 million influx last week. Similarly, Solana-focused ETFs recorded $12.70 million in inflows on Monday, marking their seventh consecutive day of inflows. It builds upon the $188.22 million of weekly inflow last week. Taken together, the ETF data suggests strong institutional focus, indicating that Solana and Ripple remain among the key areas of interest for institutional investors.
Ripple plans a rebound from the key support cluster
Ripple trades above at $1.5000 at press time on Tuesday, holding a constructive bullish bias as price remains above the 50-, 100-, and 200-period Exponential Moving Averages (EMAs) at $1.5016, $1.4673, and $1.4097, respectively.
From a technical perspective, the 50% retracement level, based on the downswing from $1.6999 to $1.2468, at $1.4558, reinforces the support cluster formed by rising EMAs.
The upside momentum appears moderate on the daily chart, with the Relative Strength Index (RSI) hovering near the neutral 50 level and the Moving Average Convergence Divergence (MACD) crossing just below zero.
The immediate resistance for XRP aligns with the 78.6% Fibonacci retracement level at $1.5907, which twice capped gains last week. A confirmed breakout above this level could target the $1.6999 swing high.
Cardano poised for a breakout rally
Cardano extends over 2% gains on Tuesday, above its 200-day EMA at $0.2418. The altcoin price also sits well above 50- and 100-day EMAs at $0.2172 and $0.2103, suggesting a supportive trend backdrop.
The immediate resistance cluster for Cardano aligns with the 78.6% Fibonacci retracement level, measured from $0.3136 to $0.1385, at $0.2632, and is reinforced by an overhead resistance line connecting the June 15 and July 4 highs near $0.2600. A confirmed breakout above this resistance cluster could extend its rally toward the $0.3136 swing high.
Momentum remains positive, with the RSI holding around 63, well above the midline, while the MACD holds above the signal line in the positive territory, suggesting that bullish pressure is still in play, even if the pair has started to look somewhat stretched.
On the downside, immediate support is at the 200-day EMA at $0.2481, followed by the 50-day EMA at $0.2172. Any deeper pullback could test the 50% retracement level at $0.2084, which is reinforced by the 100-day EMA at $0.2103, where buyers could potentially buy the dip.
Solana extends a solid rally, with bulls looking at $148
Solana is trading around $120 at press time on Tuesday, holding well above its 50-day, 100-day, and 200-day exponential moving averages at $102.55, $94.57, and $94.47, respectively. The long-term 100- and 200-day EMAs are on the verge of a bullish crossover, which could back the upside potential.
Momentum aligns with the upside bias, as the RSI is around 64 on the daily chart, just below the overbought threshold, while the MACD and its signal line are on the verge of a bearish crossover, suggesting moderating upside momentum.
The next notable hurdle for Solana aligns with $148.74, set by the January 13, 2026 high, projecting over 20% upside potential.
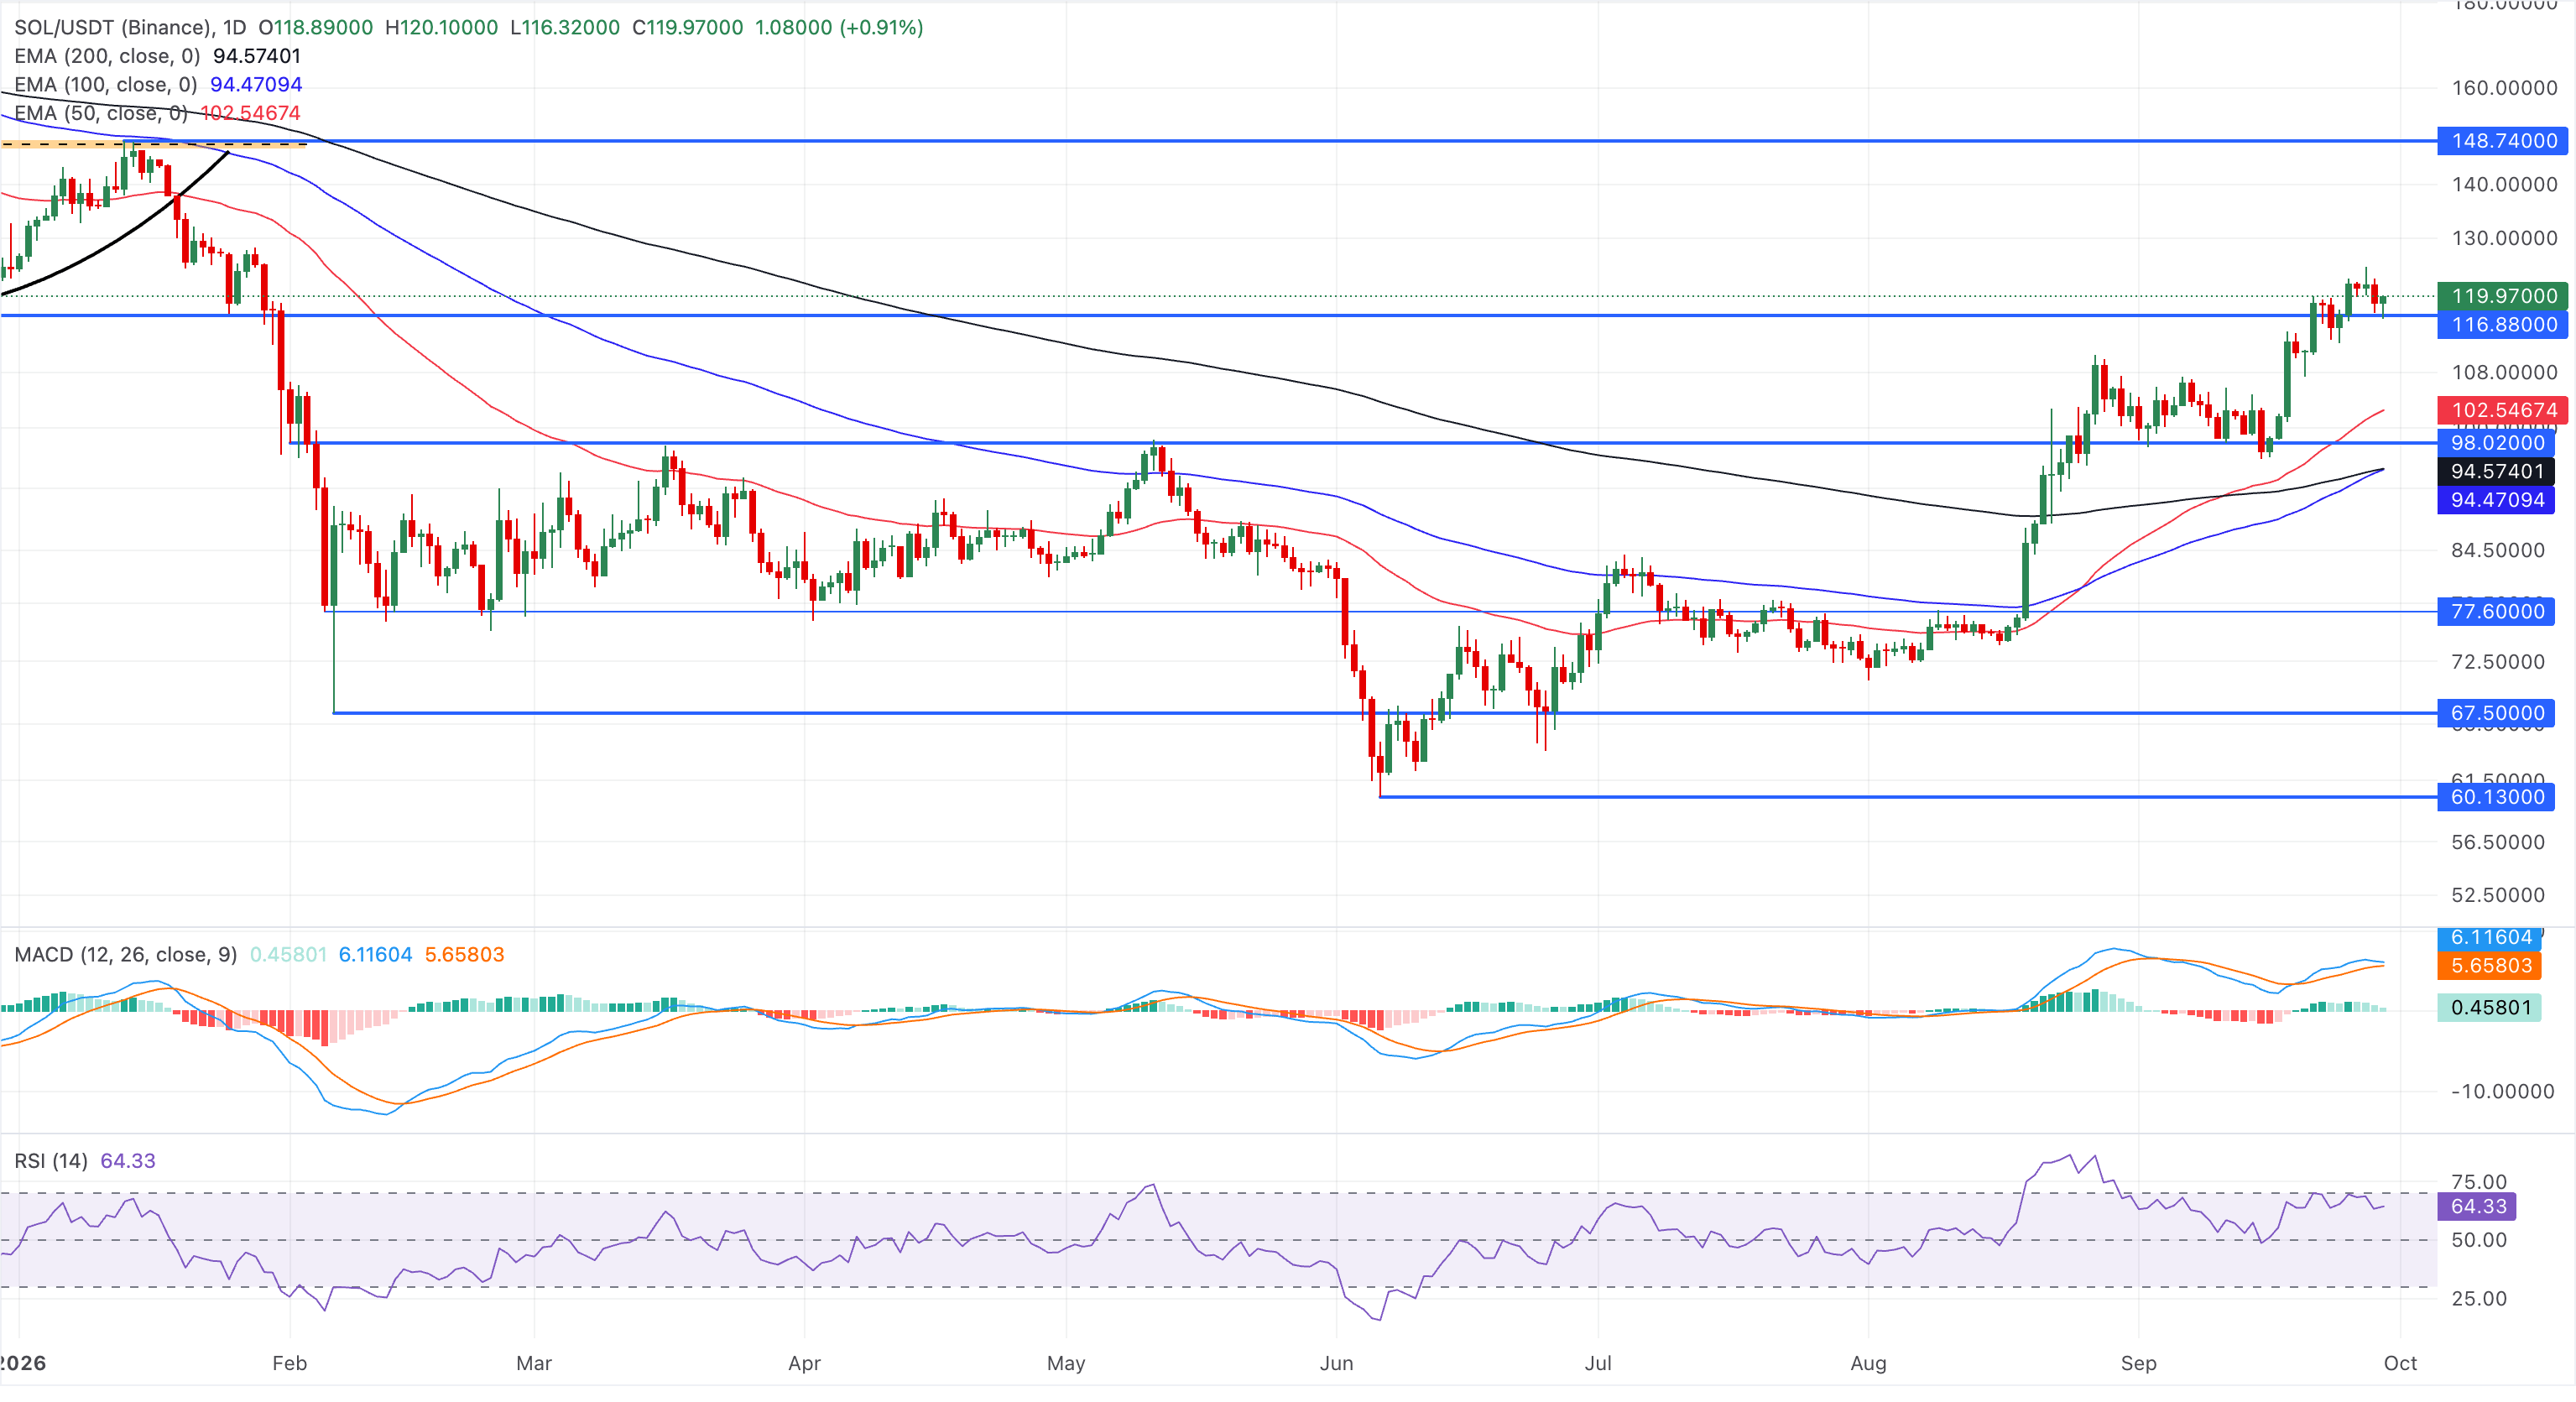
Looking down, a decisive breakdown below the $116.80 level, marked by the December 18 low, could extend the decline toward the 50-day EMA at $102.52.
(The technical analysis of this story was written with the help of an AI tool. Know more.)
Recommended Articles







Comments (0)
Click the $ button, enter the symbol, and select to link a stock, ETF, or other ticker.