


Pi Network Price Forecast: PI gains bullish strength amid positional buildup



- Pi Network edges lower on Tuesday, maintaining its marginally upward directional trend above the 50-day EMA at $0.09470.
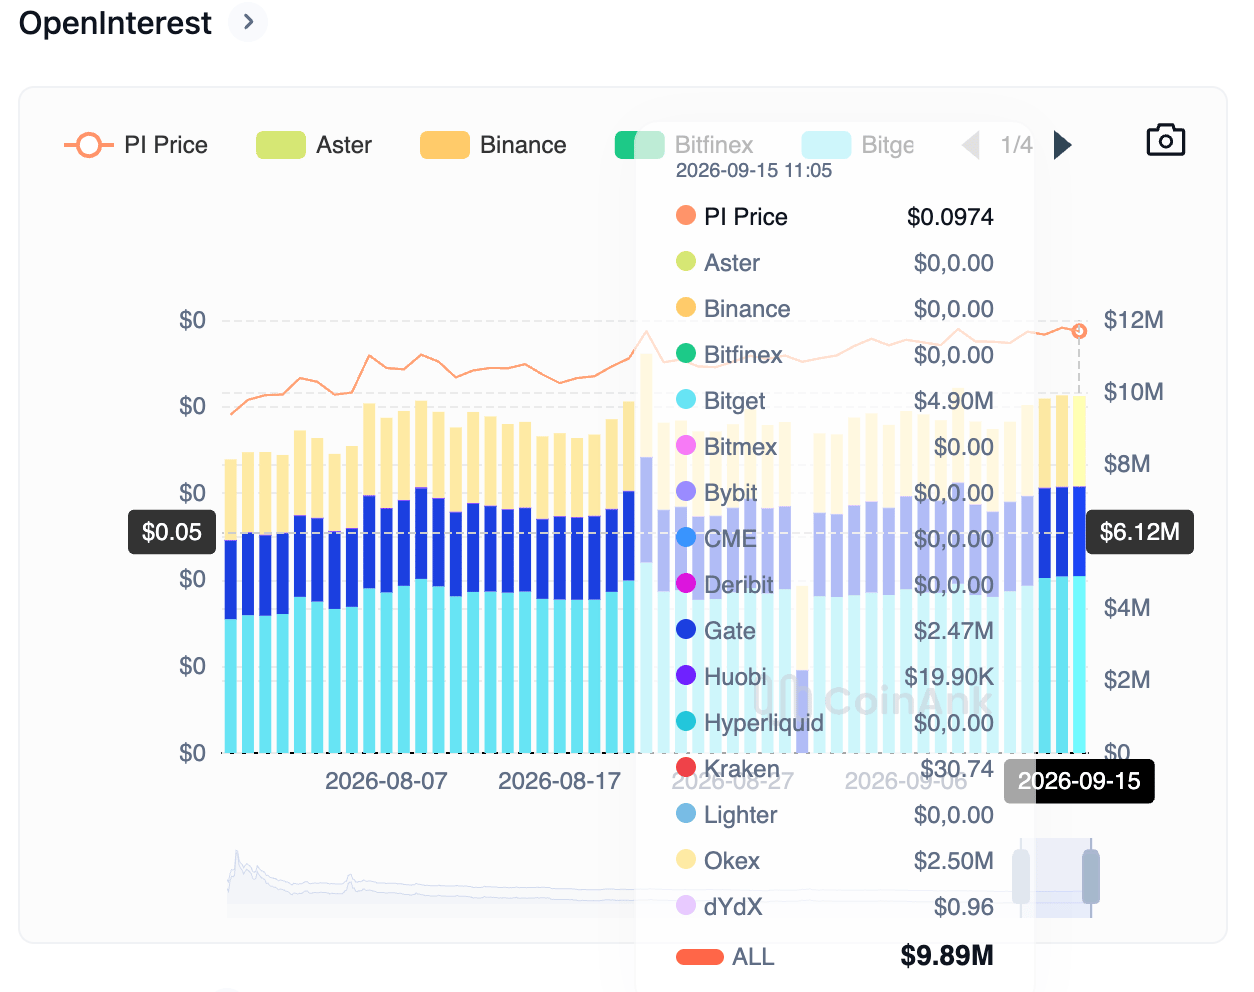
- Pi futures Open Interest holds firm at nearly $10 million, reflecting a steady buildup in positions.
- The technical outlook for PI is bullish, with indicators pointing to improved upside momentum and bulls eyeing a $0.10 breakout.
Pi Network (PI) edges lower on Tuesday, capped below the $0.10 threshold despite two consecutive bullish weekly closings. Retail demand for the PI token remains firm, with futures Open Interest holding steady at around $10 million. The technical outlook for PI indicates a bullish bias as upside momentum improves.
Retail outlook remains optimistic
Pi Network’s retail strength holds firm as the broader crypto market maintains a broadly bullish bias ahead of the CLARITY Act cloture vote on Tuesday. CoinAnk data shows the PI futures Open Interest (OI) is at $9.89 million, up from $8.98 million on Friday, signaling an increase in the notional value of existing contracts or a positional buildup.
In the case of Pi Network, a positional buildup would suggest a tentative return to risk-on positioning among traders.
Technical outlook: Pi Network’s slow movement eyes $0.10 breakout
Pi Network trades around $0.0970 at press time on Tuesday, maintaining a near-term constructive tone above its 50-day Exponential Moving Average (EMA) at $0.0947. PI token also holds above the 50% retracement level of the $0.1341-$0.0704 downswing, at $0.0971, reaffirming the near-term recovery.
Still, price remains capped below the 100-day EMA at roughly $0.1051, which serves as the immediate resistance. A confirmed breakout above $0.1051 could target the 78.6% Fibonacci retracement level at $0.1168, followed by the $0.1341 swing high.
The Relative Strength Index (RSI) at about 59 on the daily chart hovers above the midline, suggesting steady upside pressure. Meanwhile, the Moving Average Convergence Divergence (MACD) and its signal line are marginally above the zero line with a positive slope, hinting at gradually improving upside momentum.
On the downside, immediate support emerges at the 50-day EMA near $0.0947, followed by the 23.6% Fibonacci retracement near $0.0819 and the $0.0704 swing low if selling pressure deepens.
(The technical analysis of this story was written with the help of an AI tool. Know more.)
Recommended Articles







Comments (0)
Click the $ button, enter the symbol, and select to link a stock, ETF, or other ticker.