


Pi Network Price Forecast: PI holds steady as OpenPay brings back cash-in feature



- Pi Network hovers above $0.09100 on Tuesday, holding steady in a consolidation range.
- OpenPay officially brings back the cash-in feature, enabling users to convert Pi token into OUSD stablecoin.
- The technical outlook for PI remains mixed, with bulls struggling to reclaim the $0.1000 threshold.
Pi Network (PI) price is trading in the green above $0.0910 on Tuesday, sustaining its 10% monthly gains in August. OpenPay announced the reintroduction of the cash-in feature, allowing users to convert PI tokens and other altcoins into the OUSD stablecoin, on Monday. Pi Network must reclaim the $0.1000 psychological threshold with a confirmed breakout to sustain an upward trend.
OpenPay’s cash-in feature for PI token
OpenPay, a Web3 decentralized wallet linked to Pi Network, announced the return of the cash-in feature, in response to public demand, in an X post on Monday. It supports 96 partners, including Pi Network, local Philippine banks, and global payment services like Apple Pay and PayPal.
Users opting for Pi token payment must convert their holdings to OUSD stablecoin, which can then be used for sends, QR payments, or transfers back toward a Pi Wallet. The cash-in feature could help increase the PI token’s utility and adoption in the community, while additional Know Your Customer (KYC) steps on OpenPay could raise concerns.

Technical outlook: Will PI token regain bullish strength?
Pi Networ trades around $0.0915 on Tuesday, capped below the $0.1000 psychological threshold, suggesting clear overhead supply pressure. From a technical perspective, the PI token prolongs a sideways movement above the 23.6% Fibonacci retracement level of $0.1341 to $0.0703 downswing at $0.0836.
Looking up, the PI token must clear the $0.1000 resistance, reinforced by the 50% retracement level at $0.1022, to sustain a bullish trend. The potential upside could target the 78.6% Fibonacci retracement level at $0.1204.
The Moving Average Convergence Divergence (MACD) and signal line are moving sideways on the daily chart, just above the zero line, suggesting reduced momentum. At the same time, the Relative Strength Index (RSI) at about 52 is mildly constructive, yet both only hint at limited upside given the dense overhead supply structure.
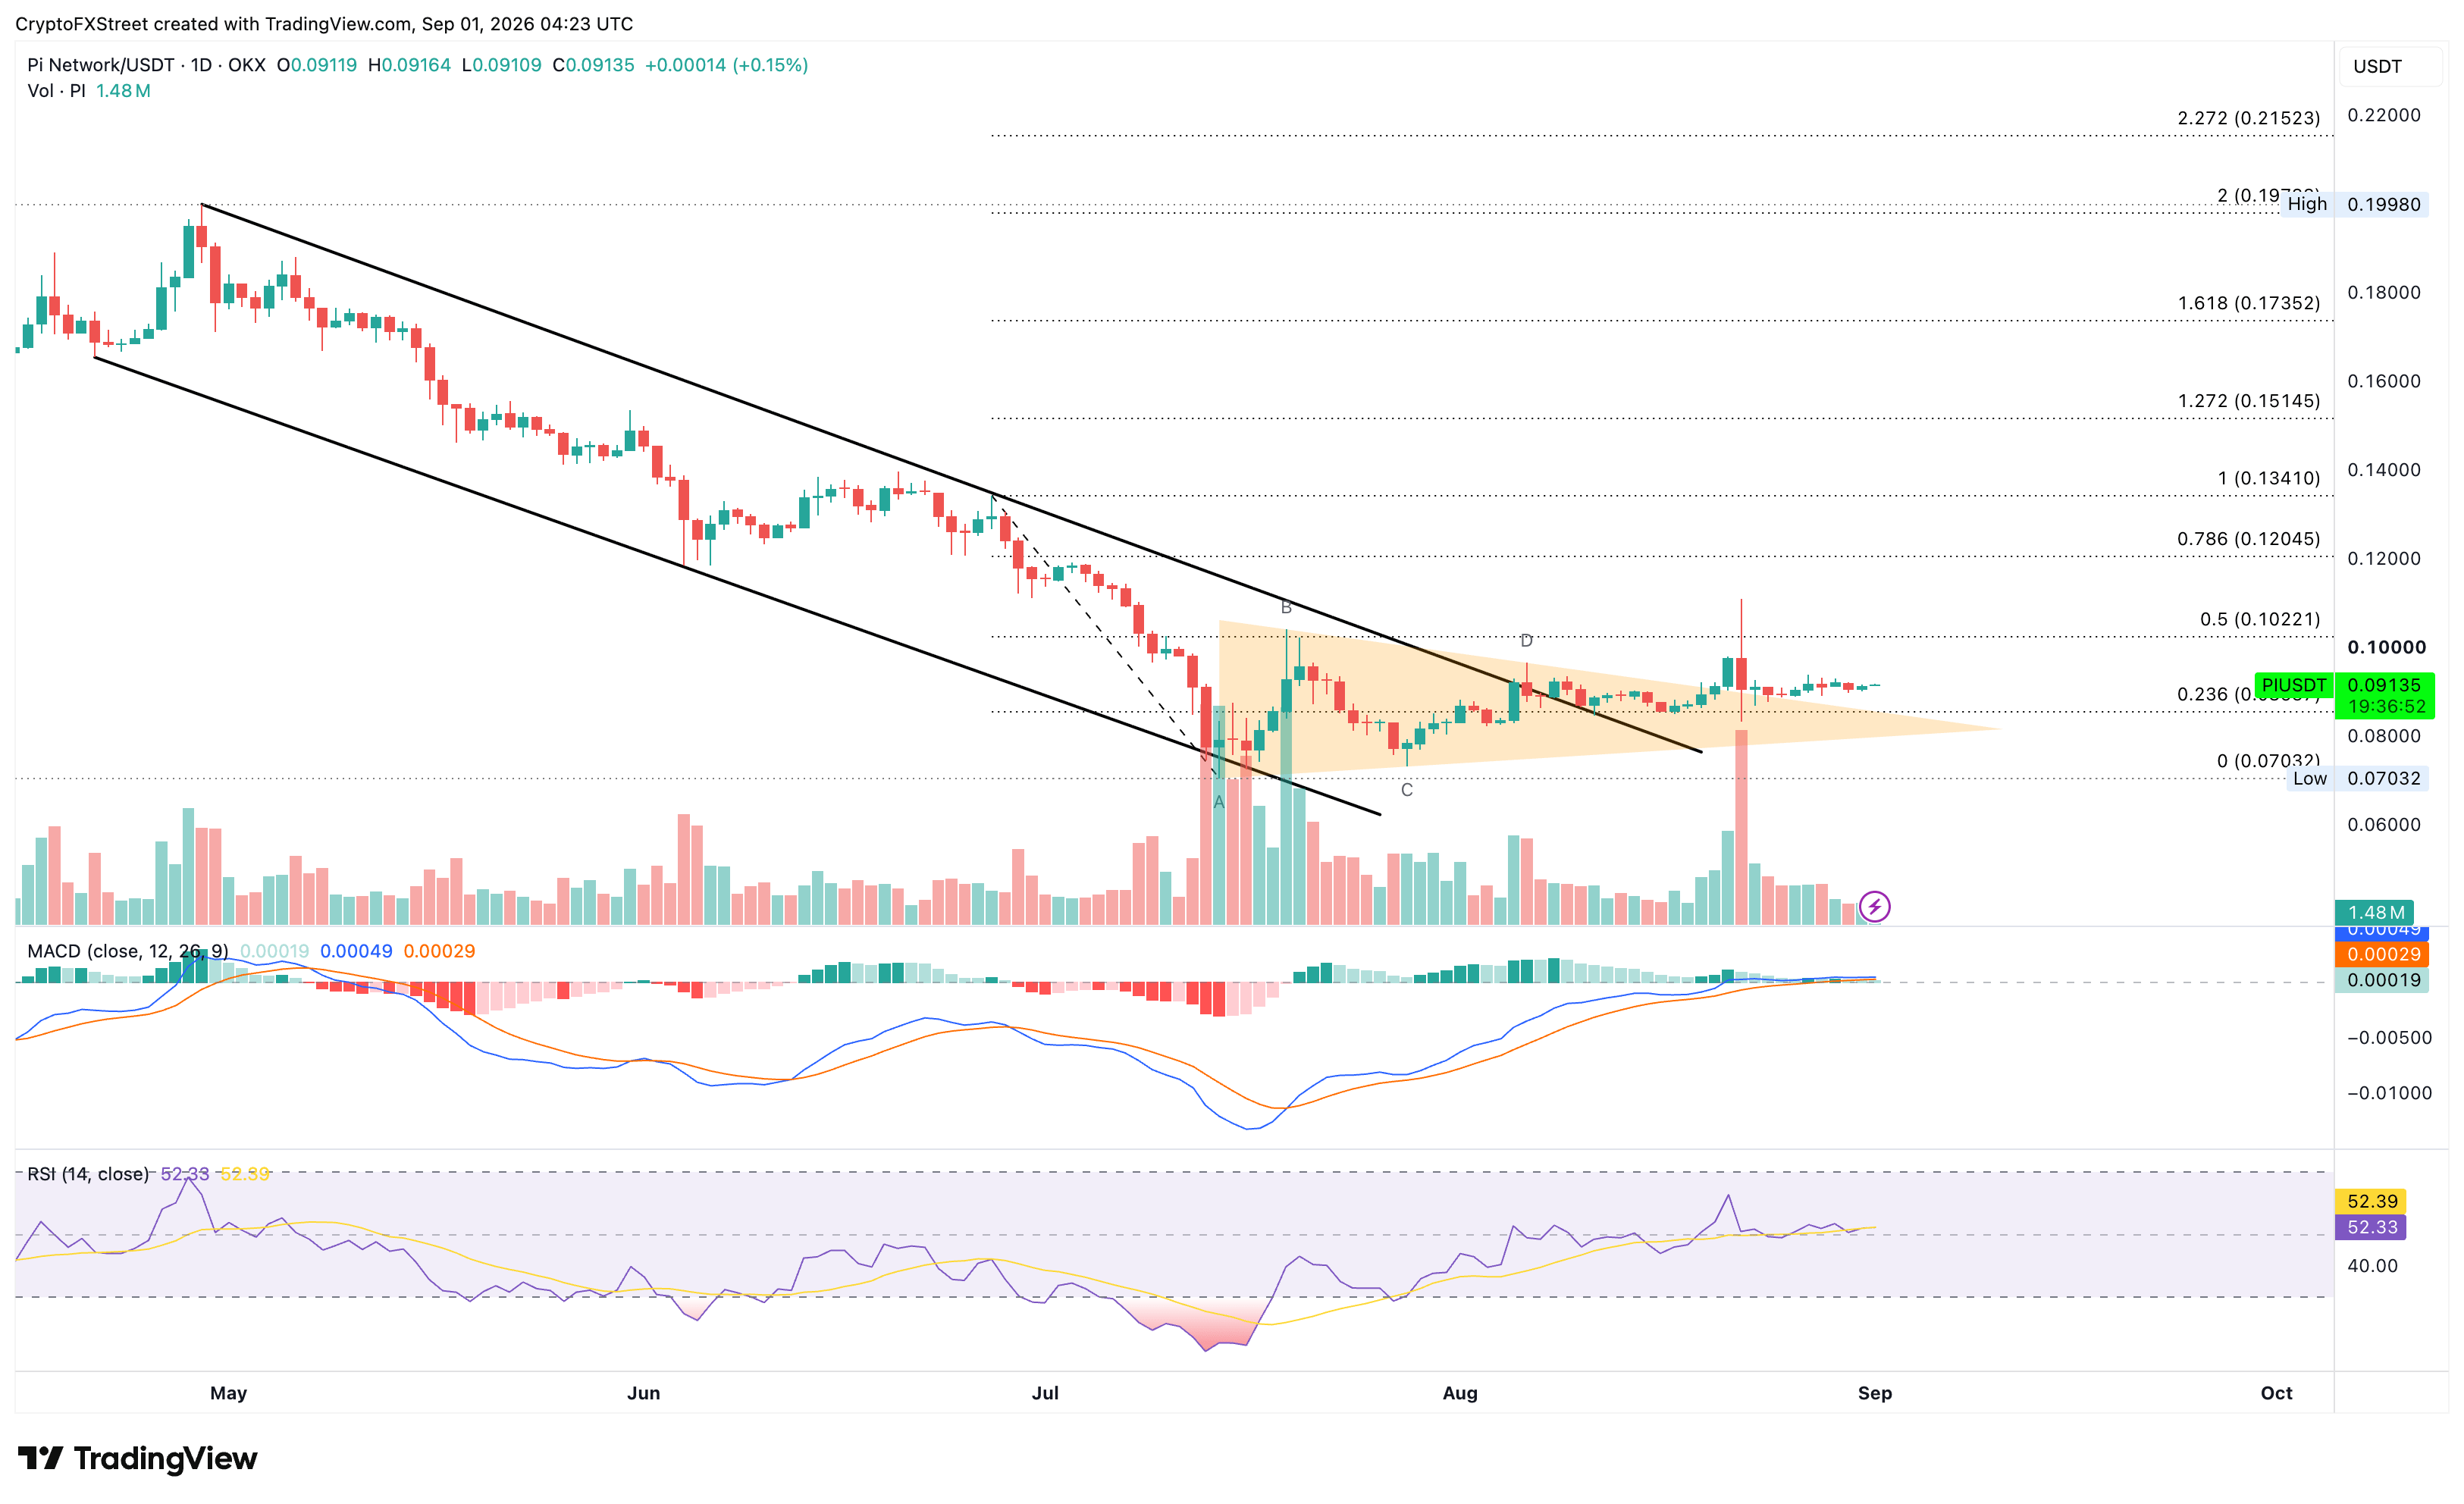
On the downside, a confirmed breakout below $0.0836 could target the $0.0703 swing low. A deeper correction could extend the bearish trend into a price-discovery phase.
(The technical analysis of this story was written with the help of an AI tool. Know more.)
Recommended Articles







Comments (0)
Click the $ button, enter the symbol, and select to link a stock, ETF, or other ticker.