


Hyperliquid Price Forecast: HYPE eyes 50-day EMA breakout as bullish momentum builds



- Hyperliquid extends gains on Thursday, approaching the 50-day EMA resistance at $58.36.
- Hyperliquid treasury Hyperion DeFi posts a record $31 million quarterly profit, highlighting firm ecosystem activity.
- HYPE’s technical outlook shows a mild bullish bias as upside momentum recovers.
Hyperliquid (HYPE) is trading in the green on Thursday, extending gains toward the 50-day Exponential Moving Average (EMA) at $58.36. Institutional demand remains firm as Hyperliquid treasury Hyperion DeFi saw a $31 million fair value increase in the last quarter. Hyperliquid must clear above the 50-day EMA at $58.36 to further extend its recovery.
Steady corporate, retail support backs HYPE
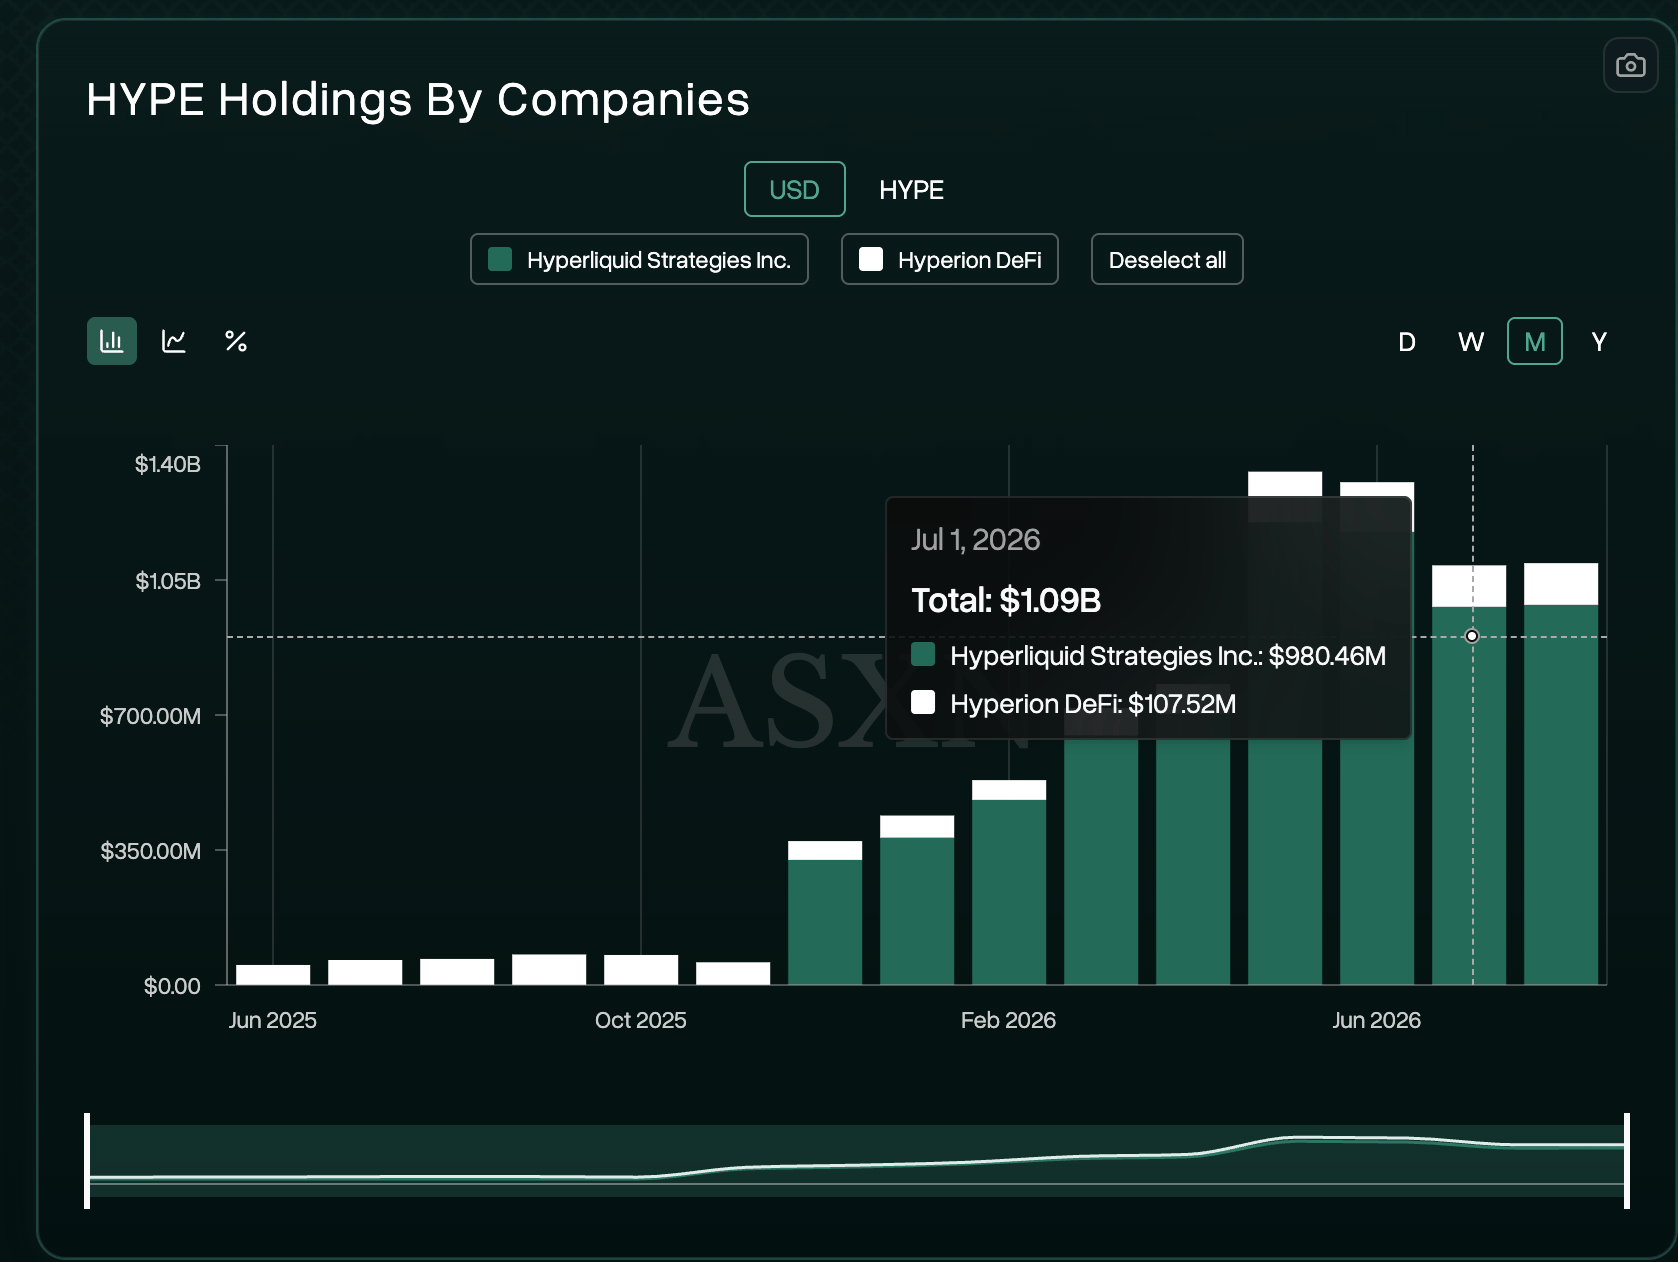
Hyperliquid holds firm demand from Corporate companies with stable exposure amid rising market value. Data shows Hyperliquid Strategies holds 17.60 million HYPE, up from 12.50 million in January, while Hyperion DeFi increased its treasury to 1.93 million HYPE, from 1.88 million. The market value of Hyperliquid Strategies and Hyperion treasuries jumped to $980 million and $107 million in Q2, up from $703 million and $77 million at the end of Q1.
Stability in HYPE-focused Digital Asset Treasuries (DATs) reflects robust ecosystem activity that attracts corporate demand.
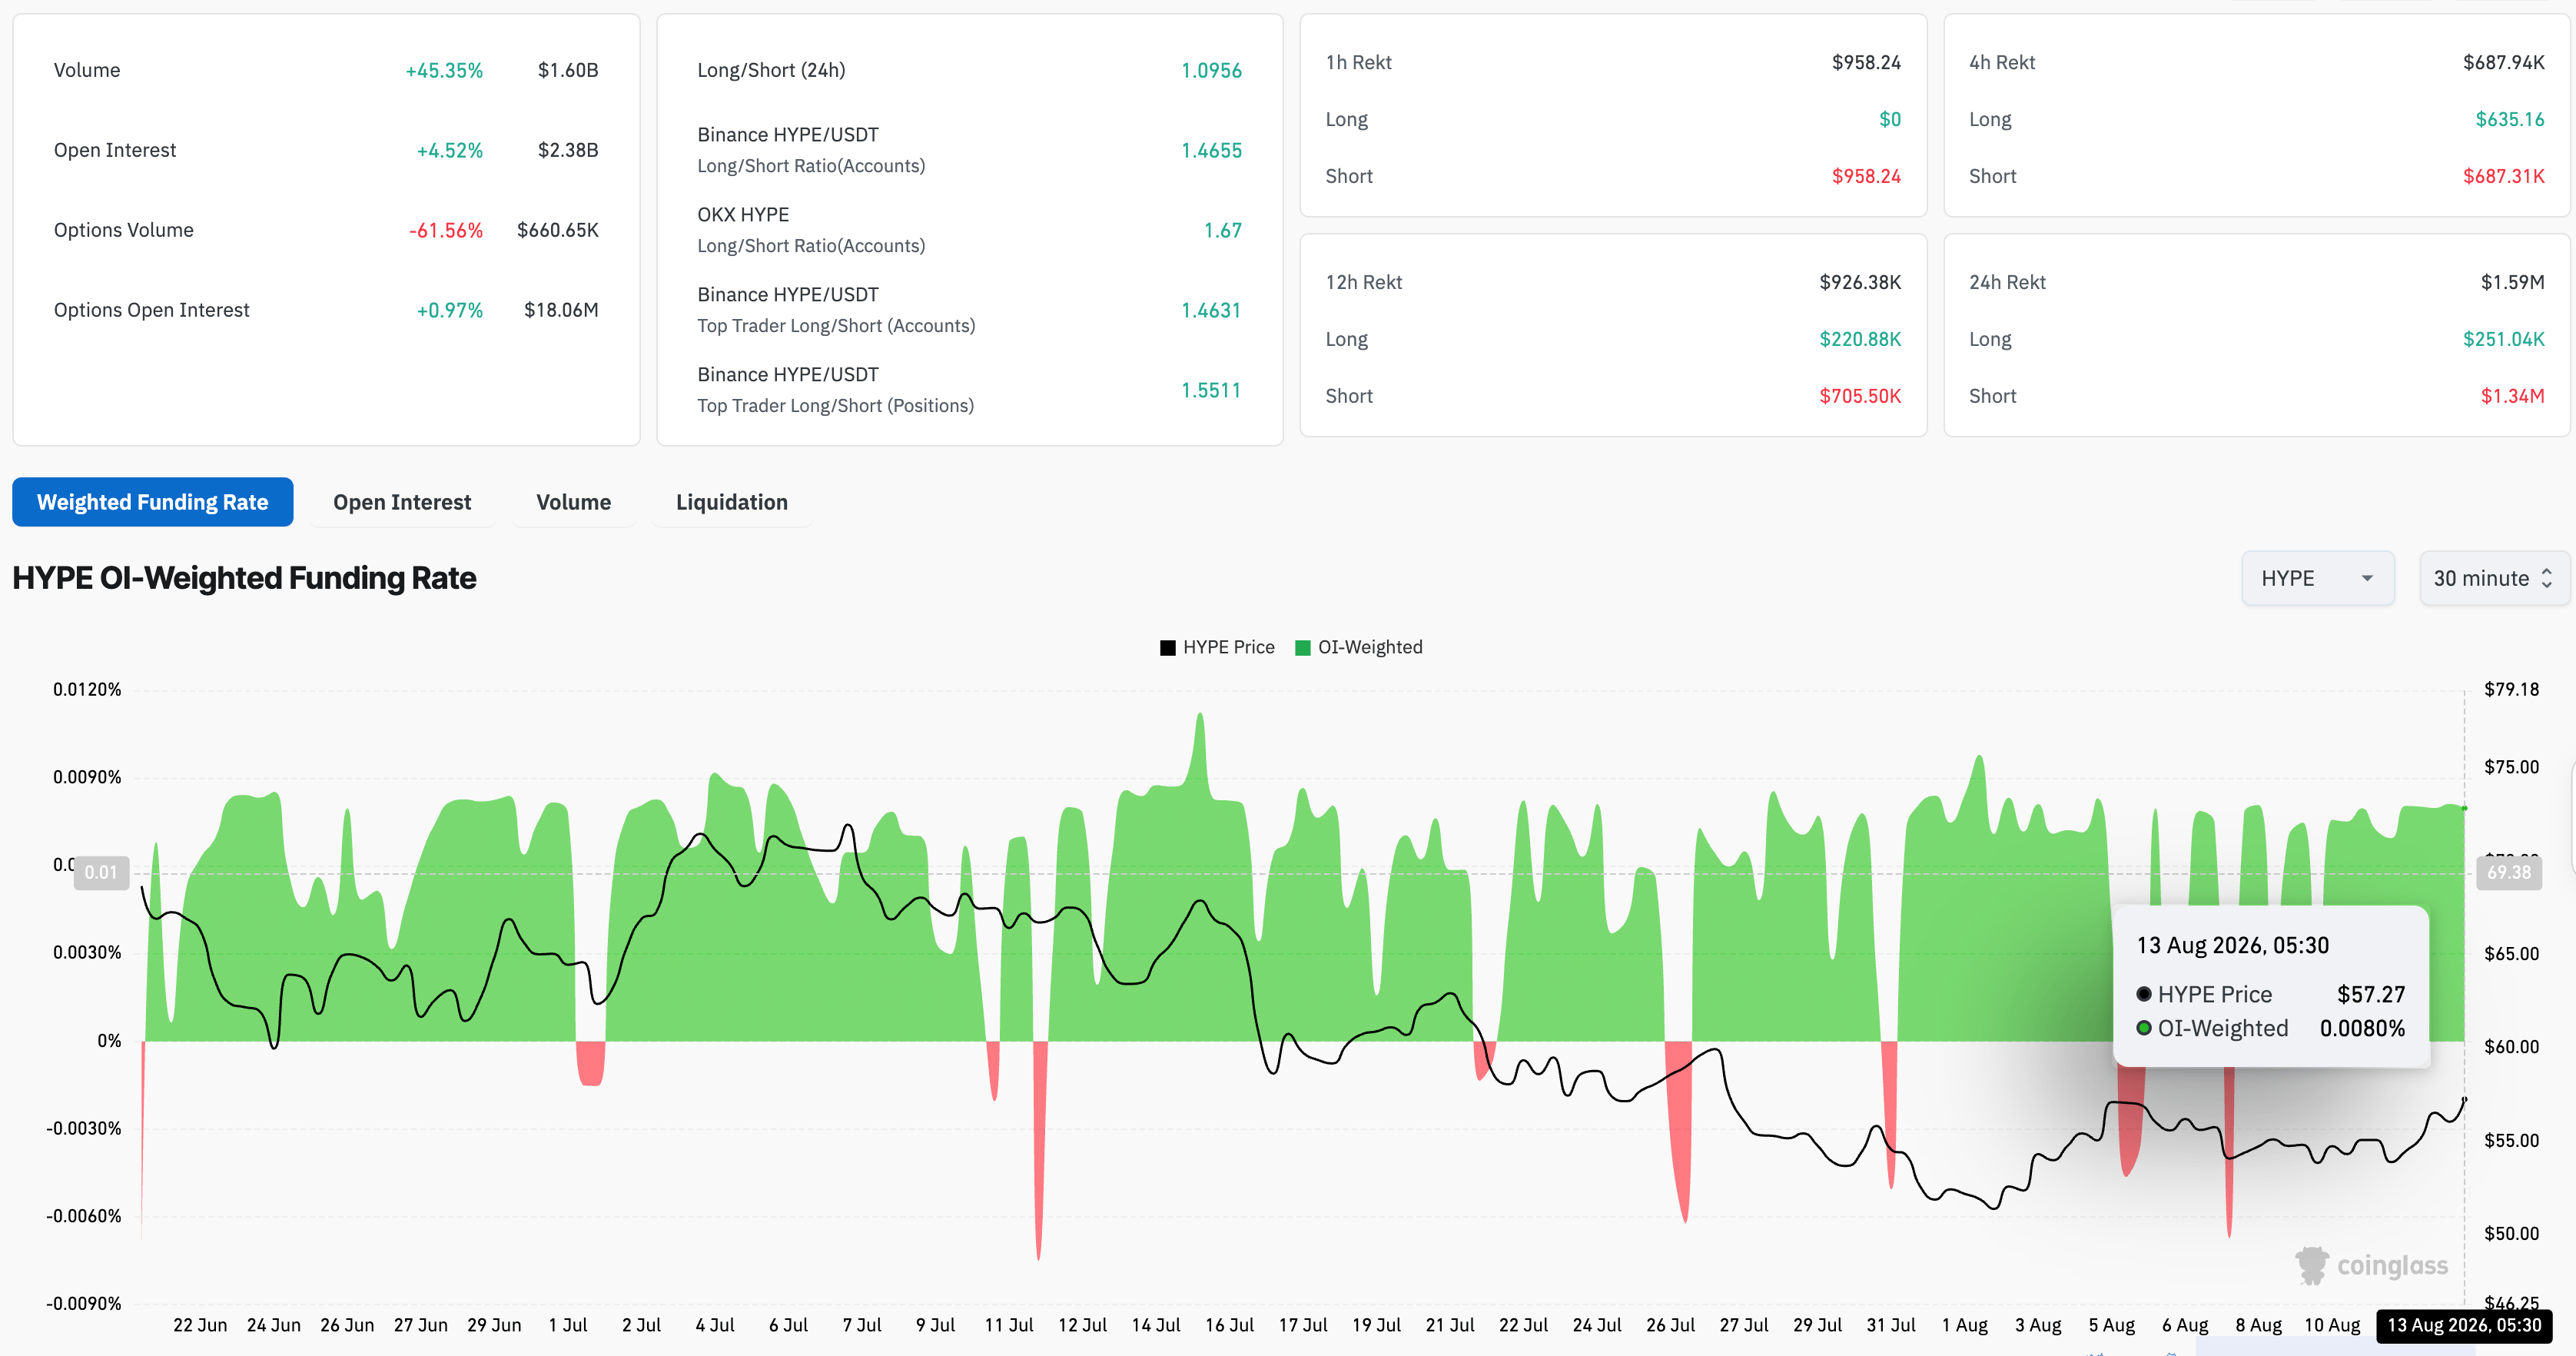
On the retail side, CoinGlass data shows HYPE futures Open Interest is up over 4% in the last 24 hours to $2.38 billion, signaling a rise in the notional value of existing contracts or a positional buildup. Retail activity is rising too, with trading volume up 45% to $1.60 billion over the same period.
Liquidation data suggests a buy-side bias, with short liquidations of $1.34 million outpacing long liquidations of $251,040 over the last 24 hours. The funding rate at 0.0080% maintains a broader positive bias, despite brief negative nosedives, indicating that traders are willing to pay a premium to hold long positions.
Technical outlook: Will HYPE price extend its rally?
Hyperliquid is up 2% at press time on Thursday, extending its nearly 3% gains from the previous day. HYPE holds above the 200-day EMA at $51.29 and the long-term trendline near $53.05, which together suggest a constructive underlying structure.
Still, the price remains below the 50-day EMA at $58.37, which caps the short-term advance. To reclaim bullish trend, HYPE must clear above $58.37, opening the path toward $62.58 supply zone.
The Moving Average Convergence Divergence (MACD) rises above the signal line with a positive histogram reading, while the Relative Strength Index (RSI) at 50 shows a minor recovery, hinting that bullish momentum is gradually rebuilding.
On the downside, initial demand is seen at the uptrend support trendline near $53.05, reinforced by the 200-day EMA at $51.29, where buyers would be expected to defend the broader bullish bias if a deeper pullback develops.
(The technical analysis of this story was written with the help of an AI tool. Know more.)
Recommended Articles








Comments (0)
Click the $ button, enter the symbol, and select to link a stock, ETF, or other ticker.