


Top Altcoins Price Forecast: XRP holds at make-or-break level, ADA and SOL risk 50-day EMA breakout



- Ripple holds above $1.00 on Thursday, risking a bearish breakout as downside pressure builds.
- Cardano tests the 50-day EMA at $0.1804 following a steady decline last week.
- Solana edges higher from its 50-day EMA at $75.51, extending a consolidation capped by a key resistance near $76.92.
Top altcoins, including Ripple (XRP), Cardano (ADA), and Solana (SOL), are facing downside pressure, holding at crucial support levels. The technical outlook for XRP, ADA, and SOL indicates a mild bearish bias as downside pressure mounts.
Technical outlook: Could XRP, ADA, and SOL break below their key support levels?
XRP trades around at $1.0116, holding in a bearish configuration as price remains below the 50-day, 100-day, and 200-day Exponential Moving Averages (EMAs) at $1.0911, $1.1727, and $1.4041, respectively. The cluster of descending EMAs above price suggests rallies are likely to face supply, while the $1.00 remains a crucial psychological threshold on the downside.
A decisive close below $1.000 could extend the correction below the S1 Pivot level at $0.9945, risking a drop to the S2 Pivot level at $0.9271.
The Relative Strength Index (RSI) at around 37 on the daily chart suggests weak but not extreme downside momentum. At the same time, the Moving Average Convergence Divergence (MACD) extends deeper into the negative territory, consistent with rising bearish pressure.
On the topside, initial resistance is located at the 50-day EMA near $1.0911, followed by the 100-day EMA at $1.1727, with the 200-day EMA much higher at $1.4041, reinforcing the broader downtrend.
Cardano trades around $0.1838, holding marginally above the 50-day EMA at $0.1804, but remains capped well below the 100-day EMA at $0.1964, leaving the near-term tone neutral. In addition, the upward-sloping trendline near $0.1617 underpins the broader structure.
The RSI around 52 suggests neutral momentum, while the MACD crosses below its signal line, reaffirming a reduction in bullish momentum.
Looking down, a break below the 50-day EMA at $0.1804 could target the upward-sloping trendline near $0.1617, which could act as a deeper structural floor if selling pressure persists.
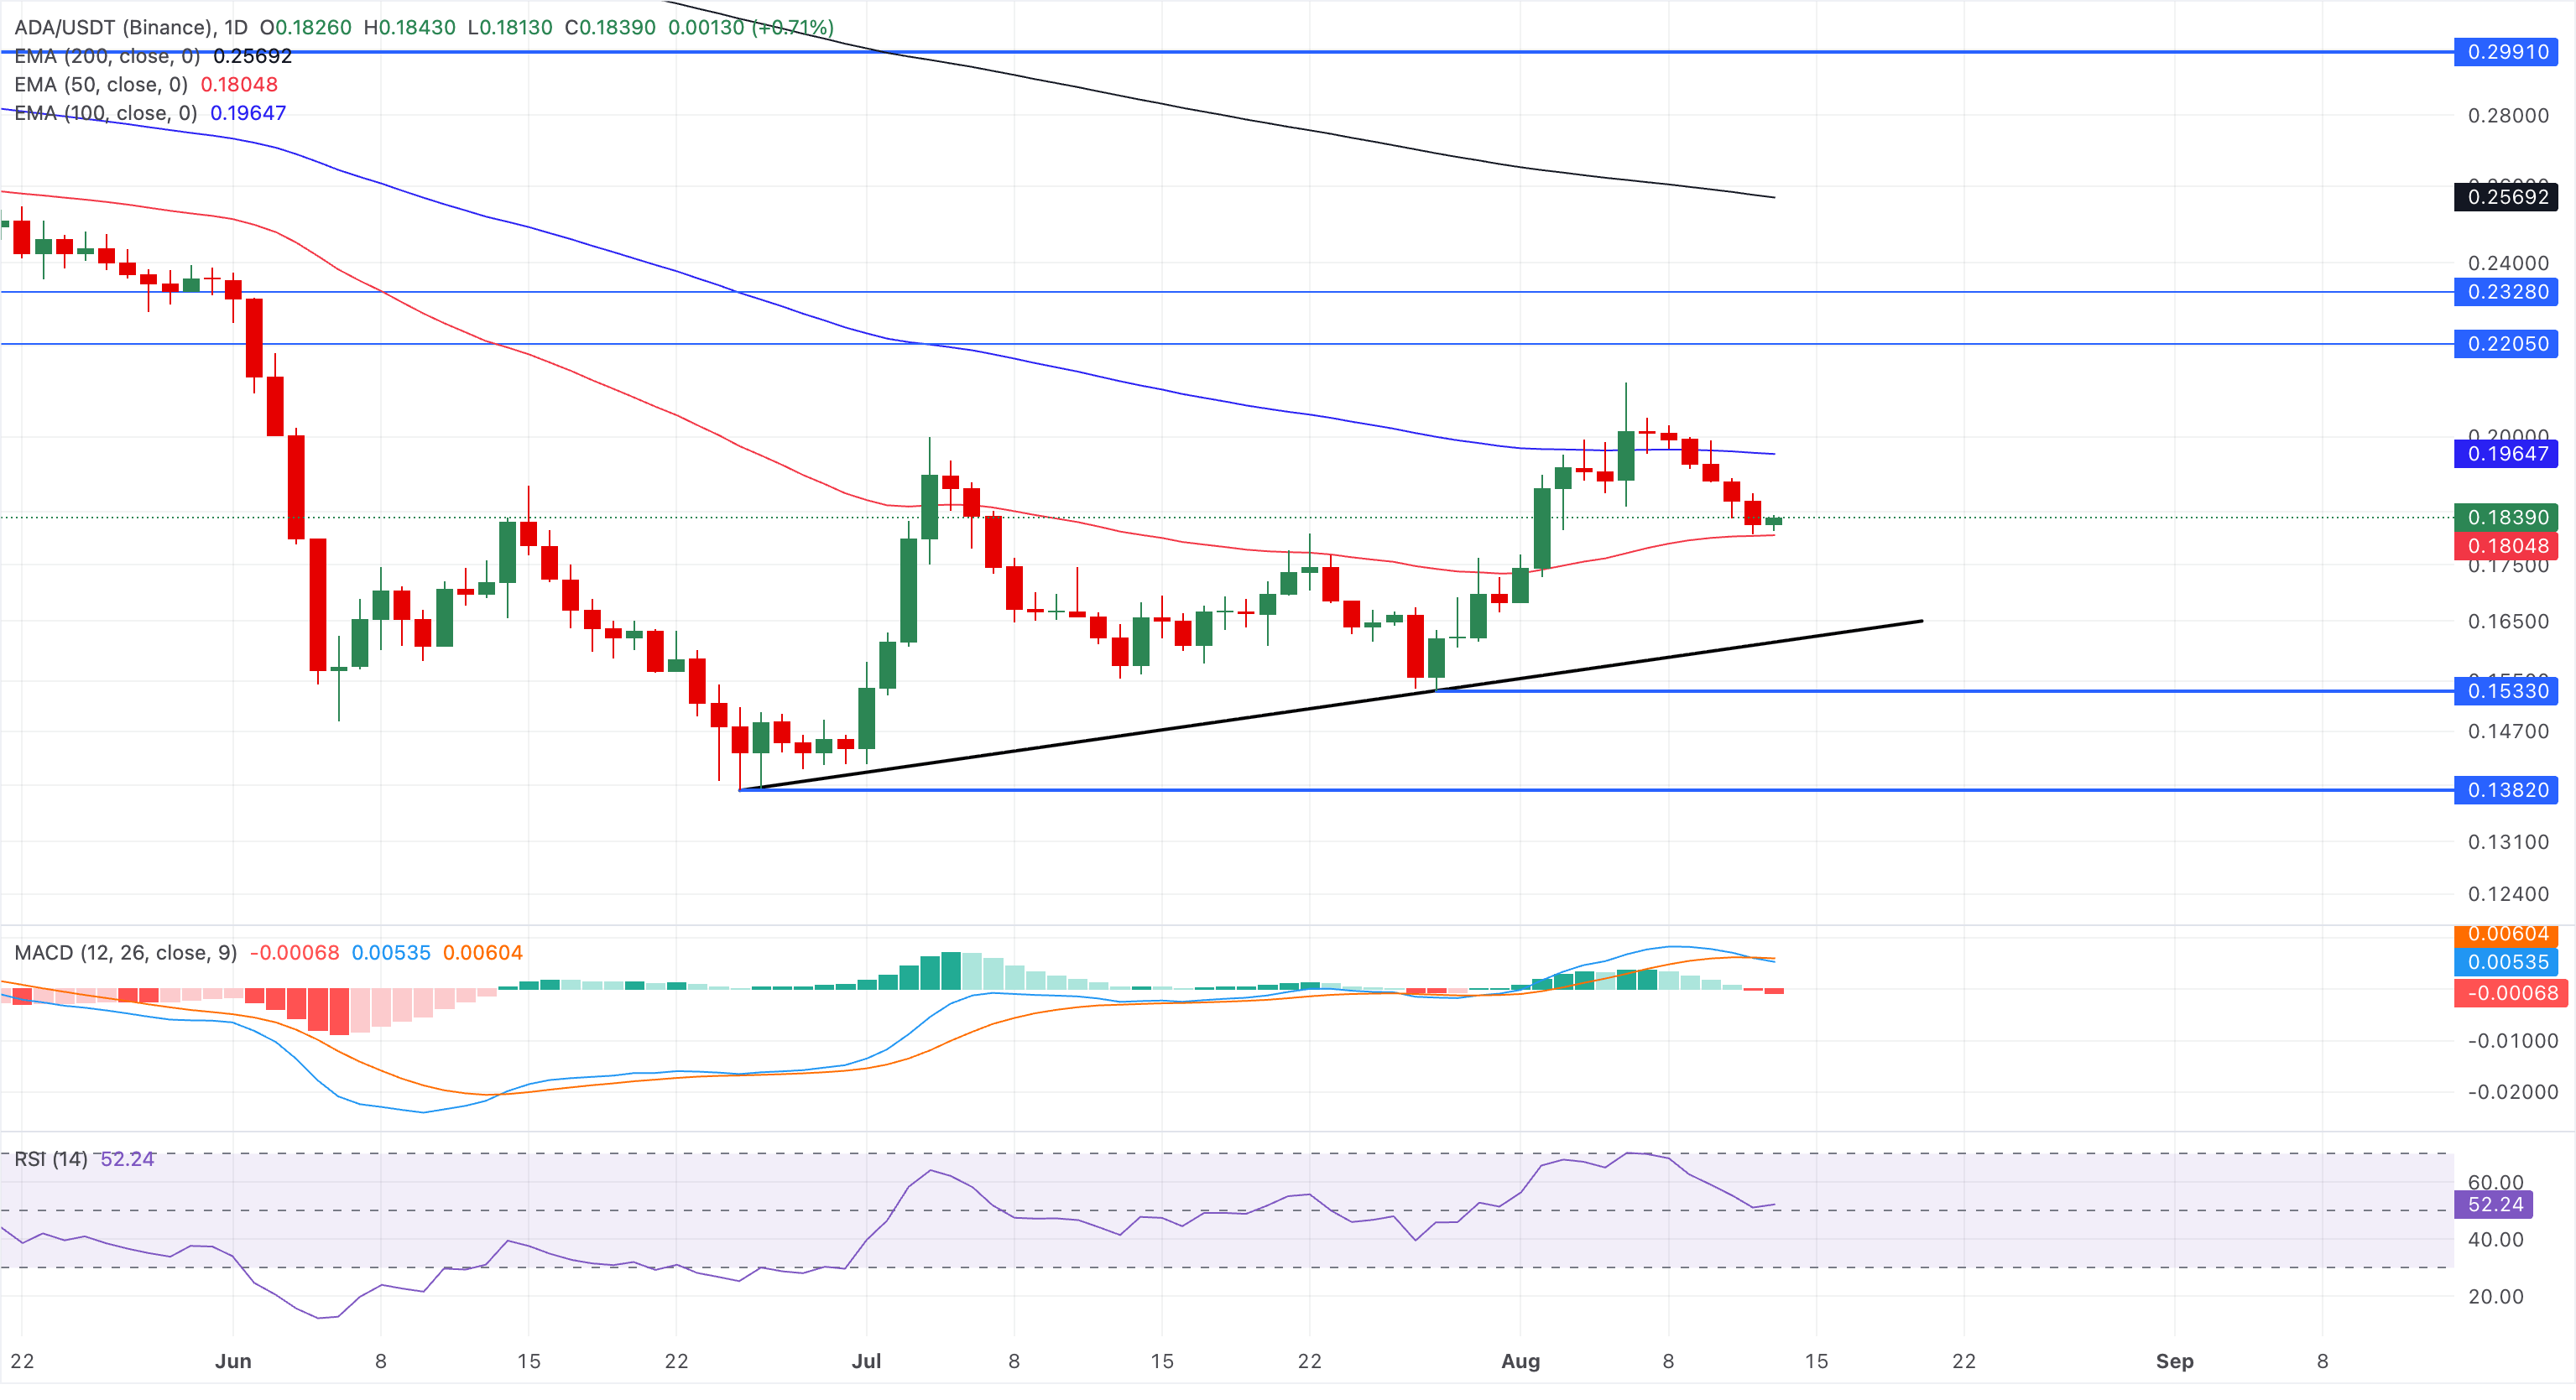
A potential rebound in ADA from the 50-day EMA at $0.1804 could face initial resistance at the 100-day EMA at $0.1964.
Similar to Cardano, Solana holds above the 50-day EMA at $75.51 and the former downtrend resistance line, now acting as support near $75.16, hinting at a mildly constructive bias. Meanwhile, the 50% retracement of the downswing from $98.41 to $60.13, at $76.92, reinforced by the 100-day EMA at $78.40, caps the upside.
To reinstate a bullish trend, SOL must clear the 100-day EMA at $78.40, which could open the path toward the 78.6% retracement level at $88.56.
Momentum aligns with this tentative upside tone, as the RSI is around 55 in neutral-to-positive territory and the MACD is positive, suggesting buying pressure is slowly rebuilding.
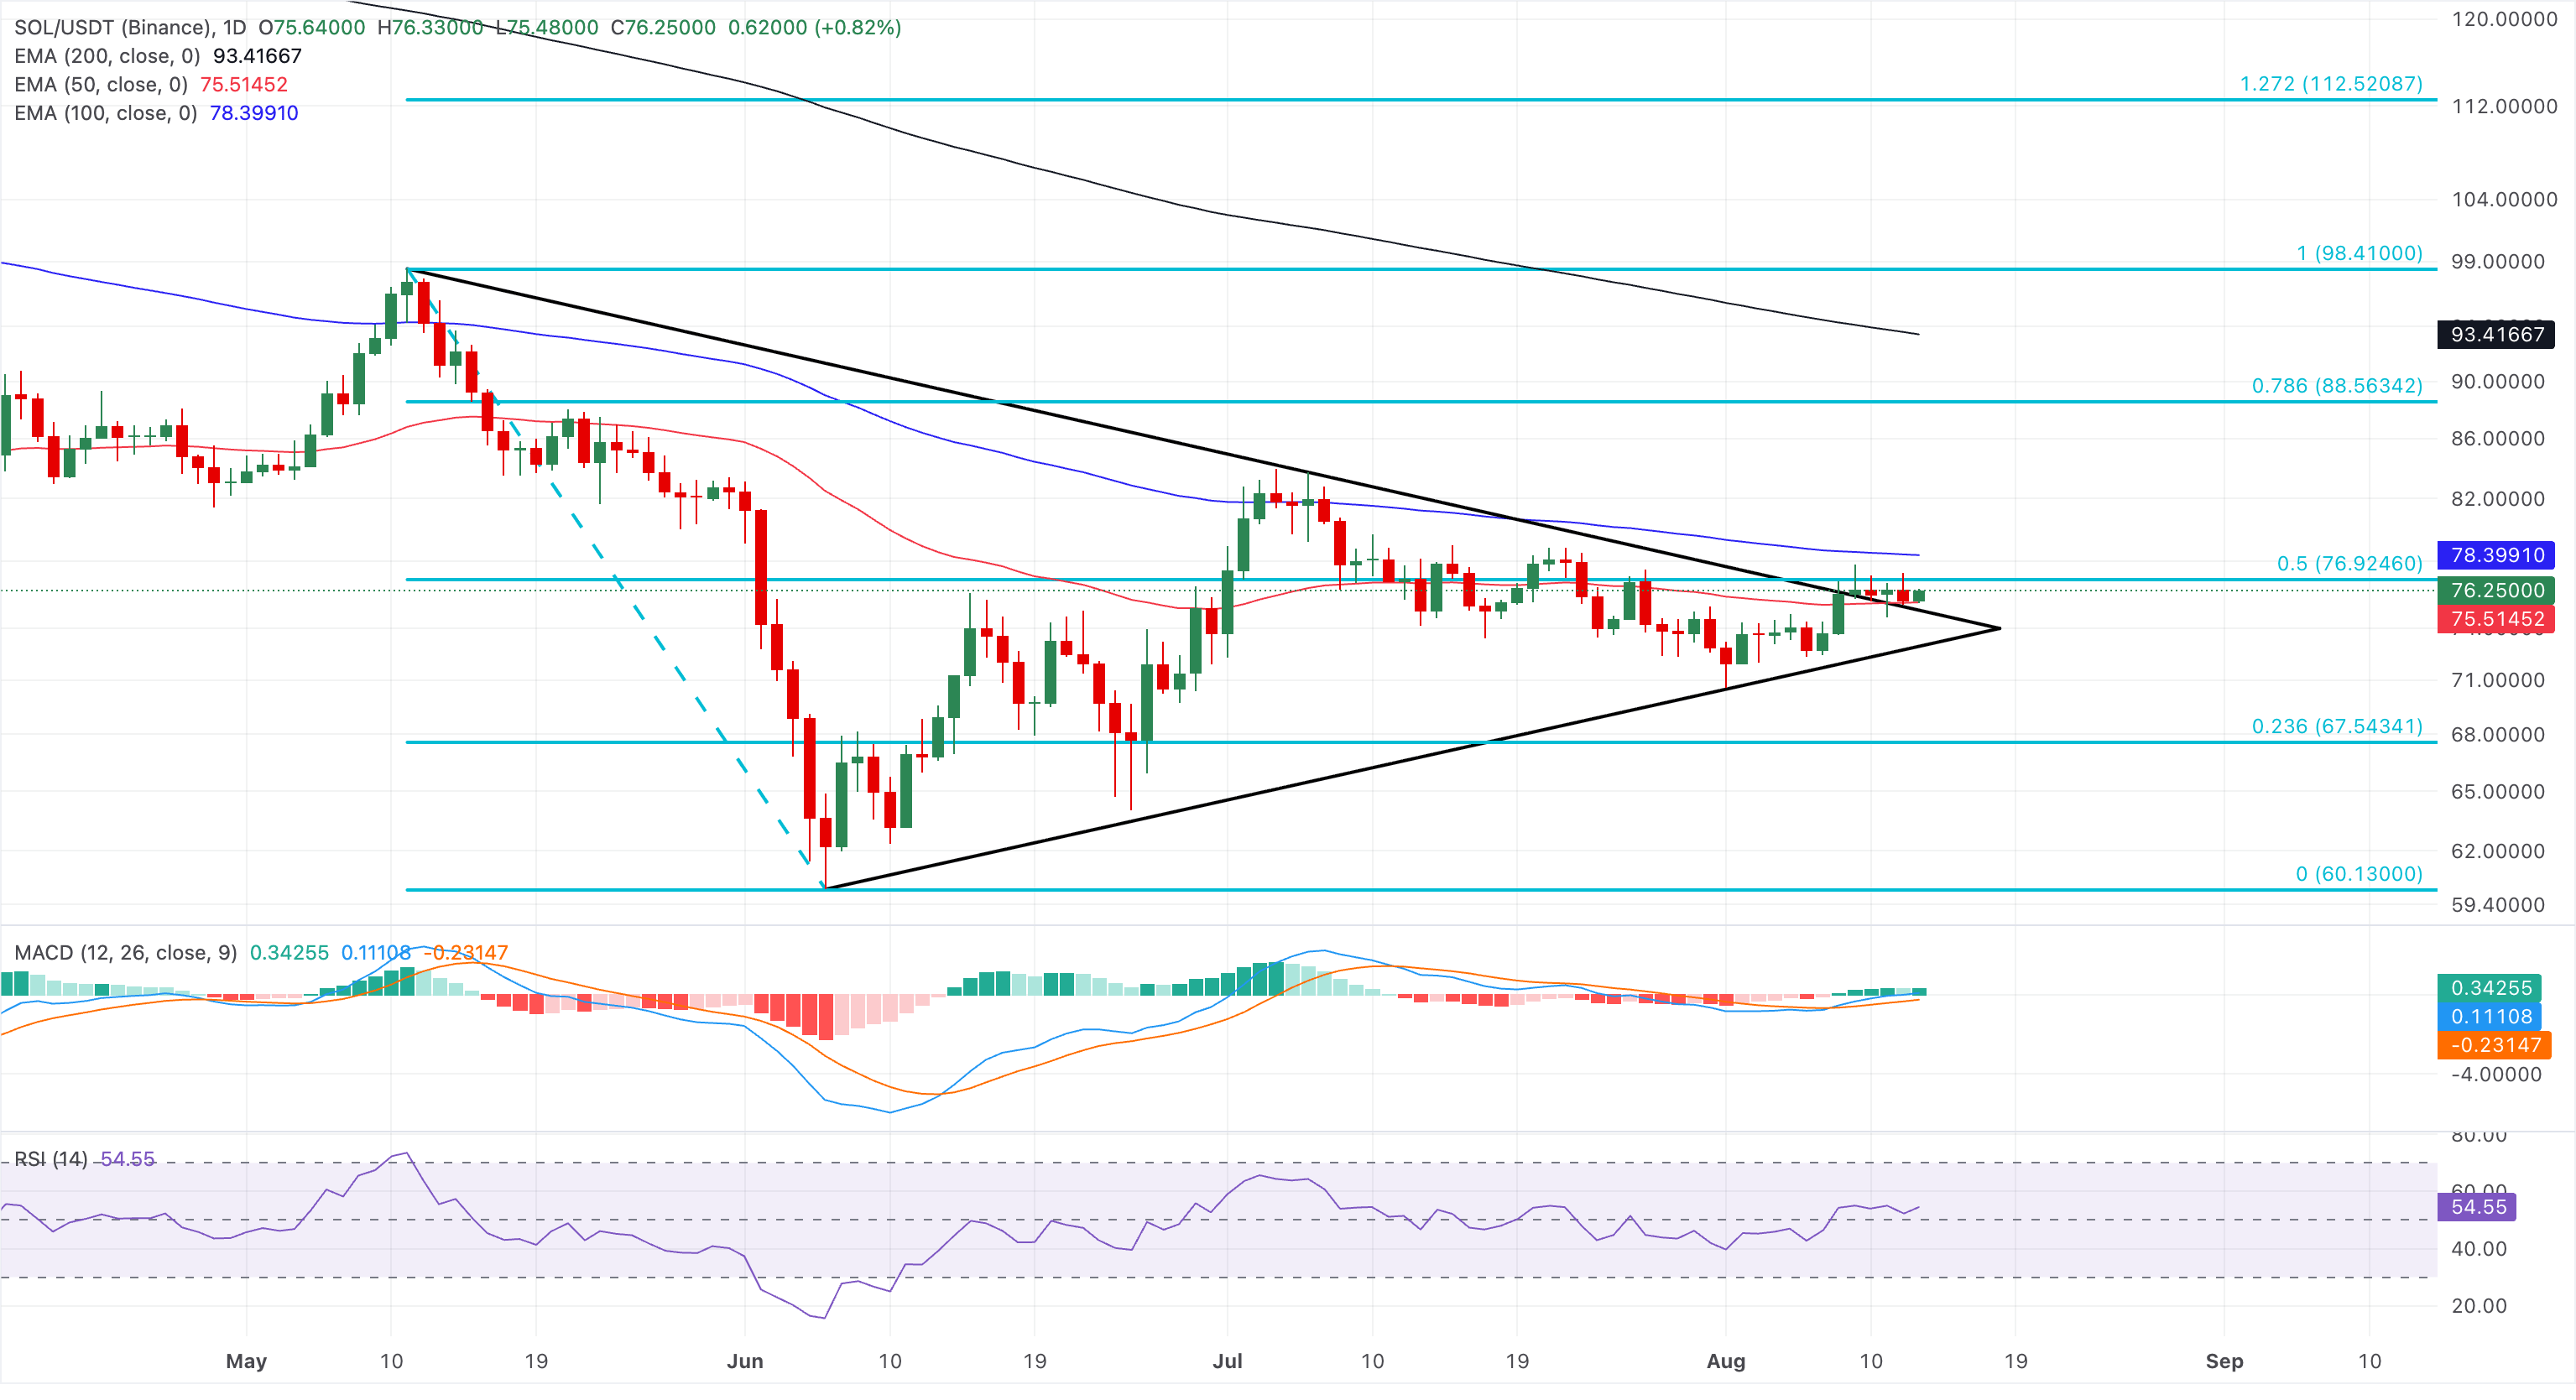
Looking down, immediate support is provided by the 50-day EMA at $75.51 and the nearby trendline floor around $75.16. A break below this area would expose the deeper 23.6% Fibonacci retracement at $67.54, and, in extremis, the cycle low near $60.13.
(The technical analysis of this story was written with the help of an AI tool. Know more.)
Recommended Articles








Comments (0)
Click the $ button, enter the symbol, and select to link a stock, ETF, or other ticker.