


Crypto Market Overview: Bitcoin steadies as BoJ flags possible rate hikes



- Bitcoin steadies above $65,000 on Monday, holding marginally above its 50-day EMA at $64,702.
- Bank of Japan flagged a possible rate hike ahead in the summary of opinions from its July meeting.
- Pump.fun and CurveDAO emerge as top performers over the last 24 hours.
The broader cryptocurrency market holds steady, with Bitcoin (BTC) trading near $65,000, above its 50-day Exponential Moving Average (EMA) of $64,702. The Bank of Japan (BoJ) released the summary of opinions from its July meeting, with nearly half of the board members leaning hawkish. Still, the near-term bullish sentiment in the crypto market holds, with Pump.fun (PUMP) and CurveDAO (CRV) leading gains over the last 24 hours.
Bank of Japan flags possible rate hikes
Bank of Japan released its summary of opinions from the July meeting on Monday, raising concerns about faster rate hikes as the Japanese Yen has dropped to a 40-year low against the US Dollar. Four of the nine board members leaned hawkish, three remained neutral, and two took a dovish stance.
Technical outlook: Will Bitcoin hold its gains?
Bitcoin hovers near $65,200 on Monday, holding above the 50-day EMA at $64,702 but remains capped beneath the 100-day EMA at $66,905 and the 200-day EMA at $72,686, which keeps the broader tone slightly bearish.
The Moving Average Convergence Divergence (MACD) has crossed above the signal line, while the Relative Strength Index (RSI) at 55 leans modestly bullish, suggesting improving short-term momentum.
On the topside, initial resistance appears at the 100-day EMA near $66,905, followed by the 200-day EMA at $72,686. A sustained break above these layers would materially shift the bias back in favor of the bulls.
Immediate support for Bitcoin is defined by the 50-day EMA at $64,702, where a daily close below would reopen scope for deeper corrective pressure.
Technical outlook: Could PUMP and CRV extend gains?
PUMP edges higher on Monday, after extending its 11% gains from Sunday. The launchpad token maintains a constructive bullish bias as price trades near its six-month high, extending its bullish breakout of the falling wedge pattern.
Momentum on the daily chart supports the breakout rally, with the RSI at 72 in the overbought zone, and the MACD sustaining an upward trend above its signal line in positive territory, with expanding bullish histograms.
Looking up, the path of least resistance for PUMP targets the December 3, 2025 high at $0.003399.
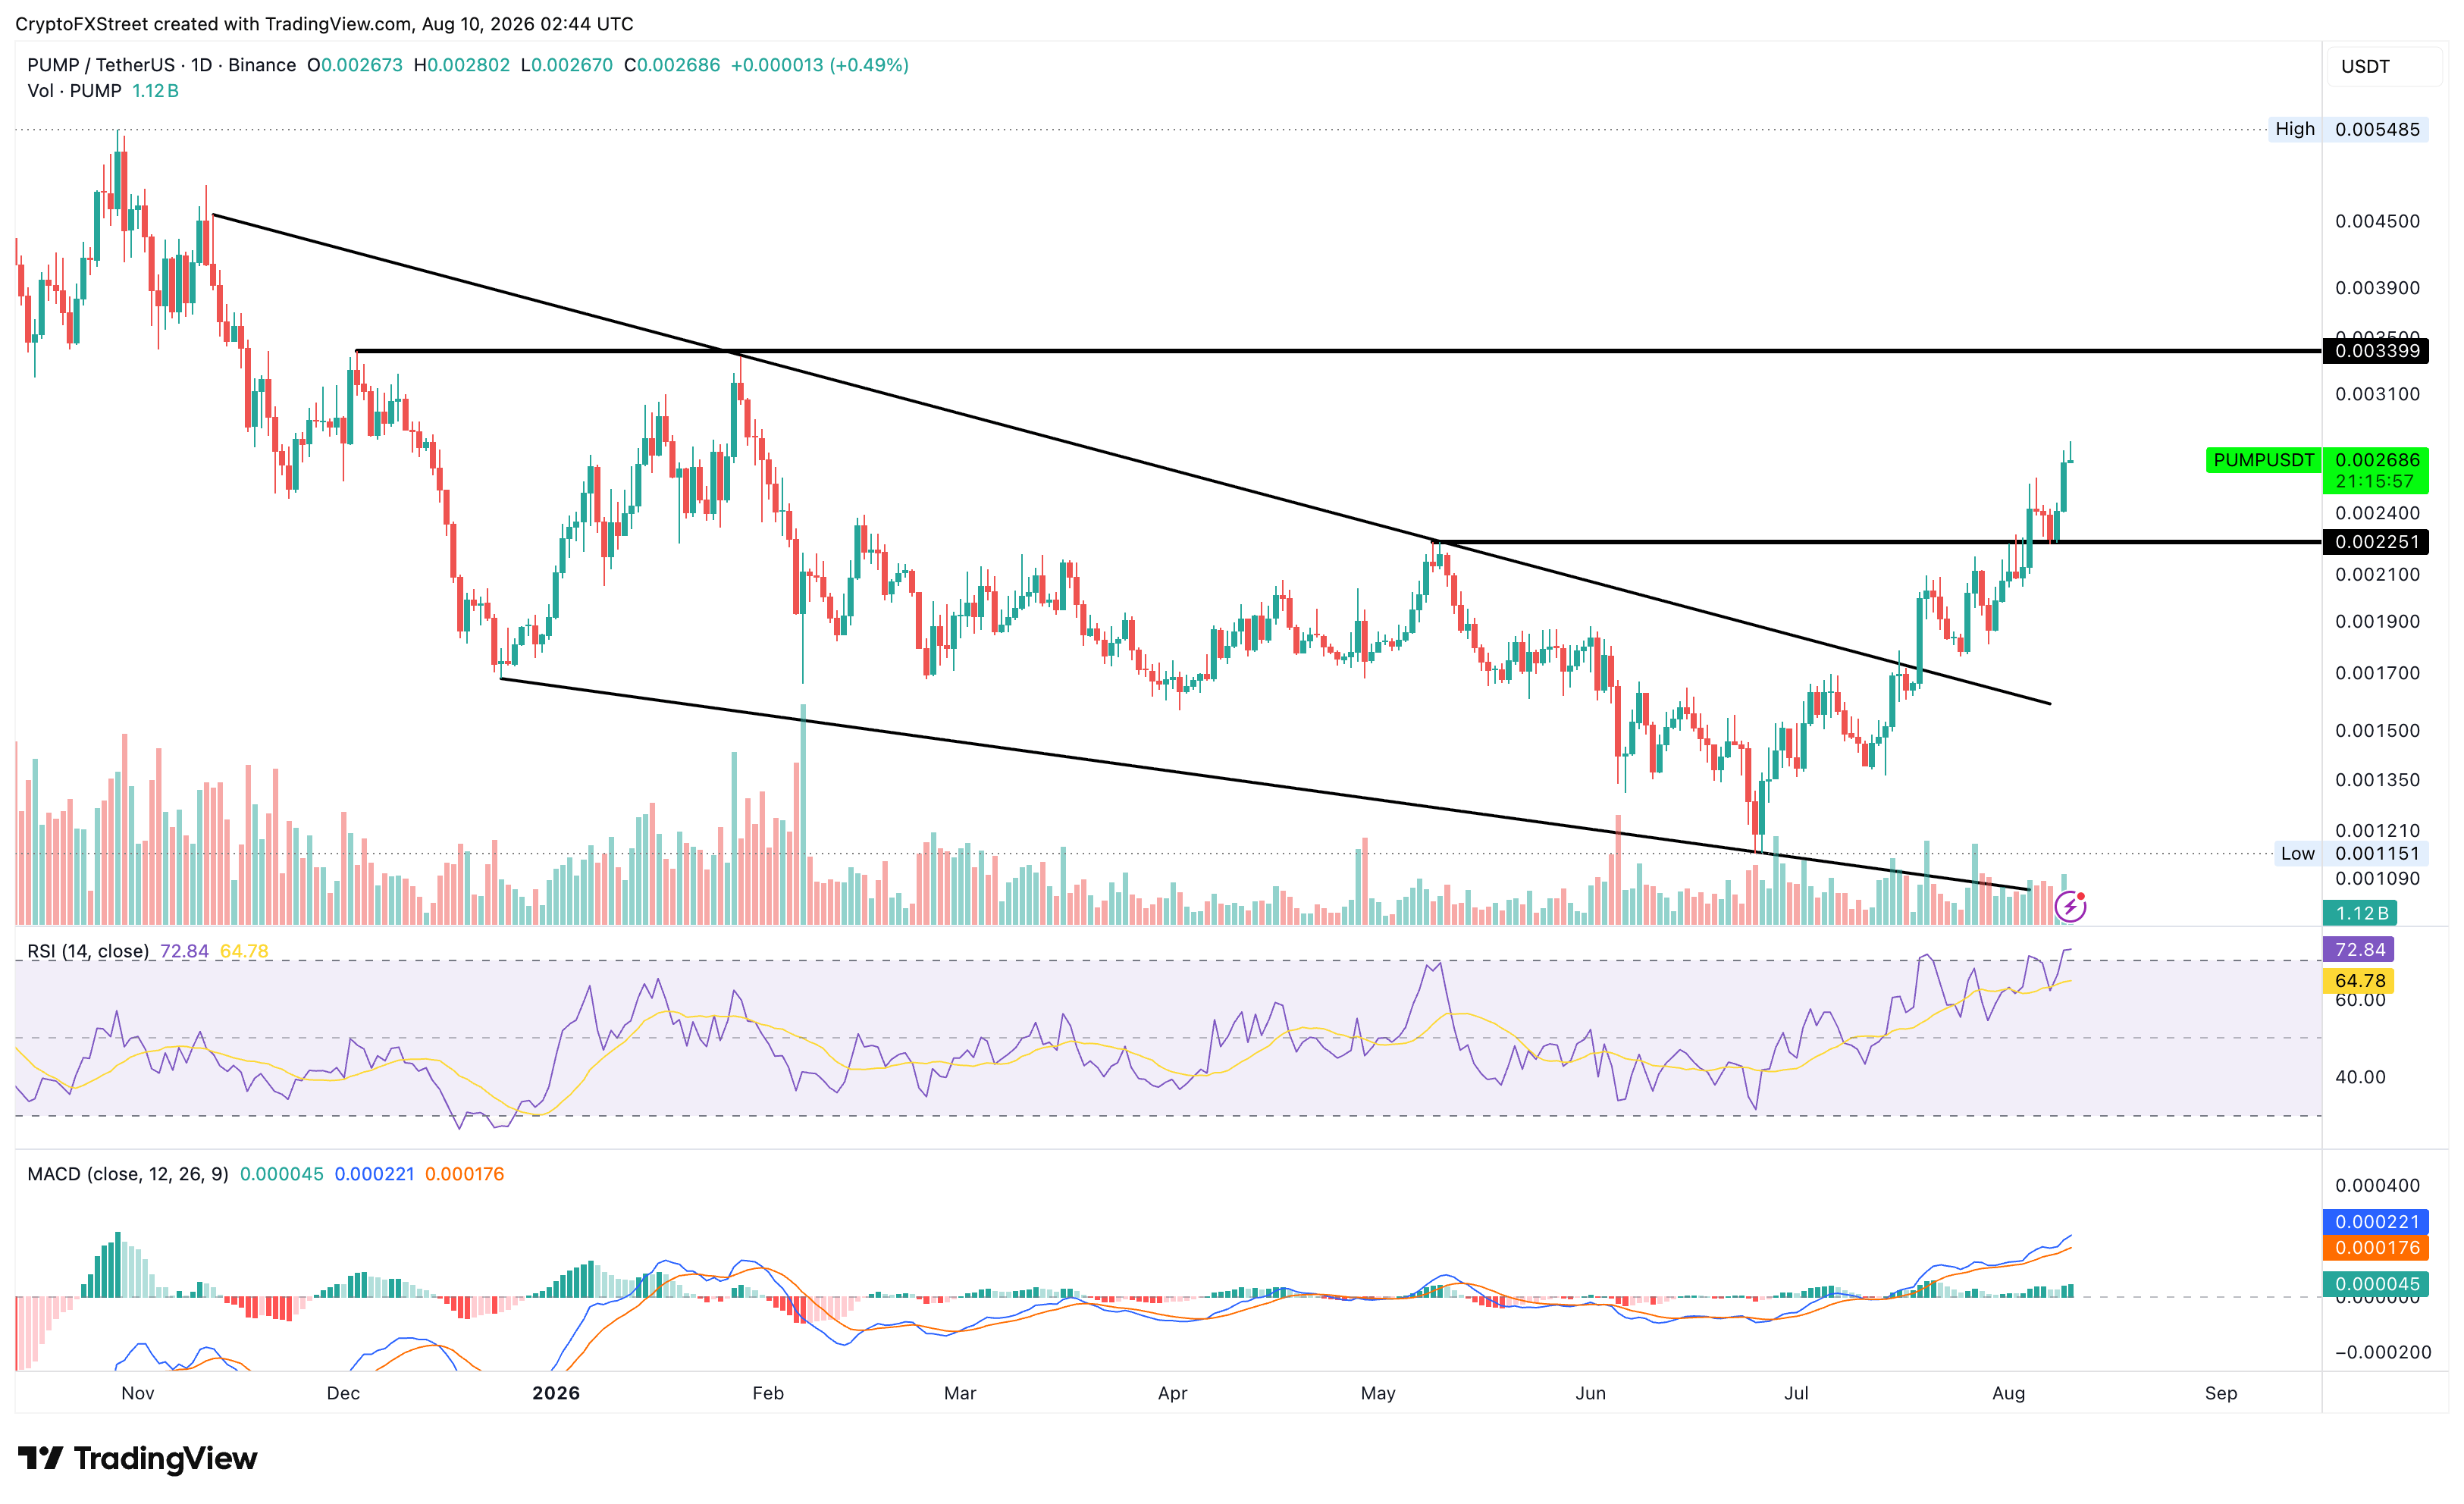
Looking down, the crucial support aligns with the reclaimed May 9 high at $0.00251.
Curve DAO extends gains for the third consecutive day on Monday, inching closer to the $0.2400 level. The CRV token maintains a bullish bias, trading above its 50-day and 100-day EMAs at $0.2135 and $0.2214, respectively, while the overhead 200-day EMA at $0.2683 reaffirms a broader bearish picture.
From a technical perspective, the CRV token is well above the 50% retracement level at $0.2232, measured from the $0.2931 high to the $0.1700 low.
Looking up, the recovery could face immediate resistance at the 78.6% Fibonacci retracement level at $0.2608, reinforced by the 200-day EMA at $0.2683. A decisive close above this cluster could extend the recovery toward the $0.2931 level.
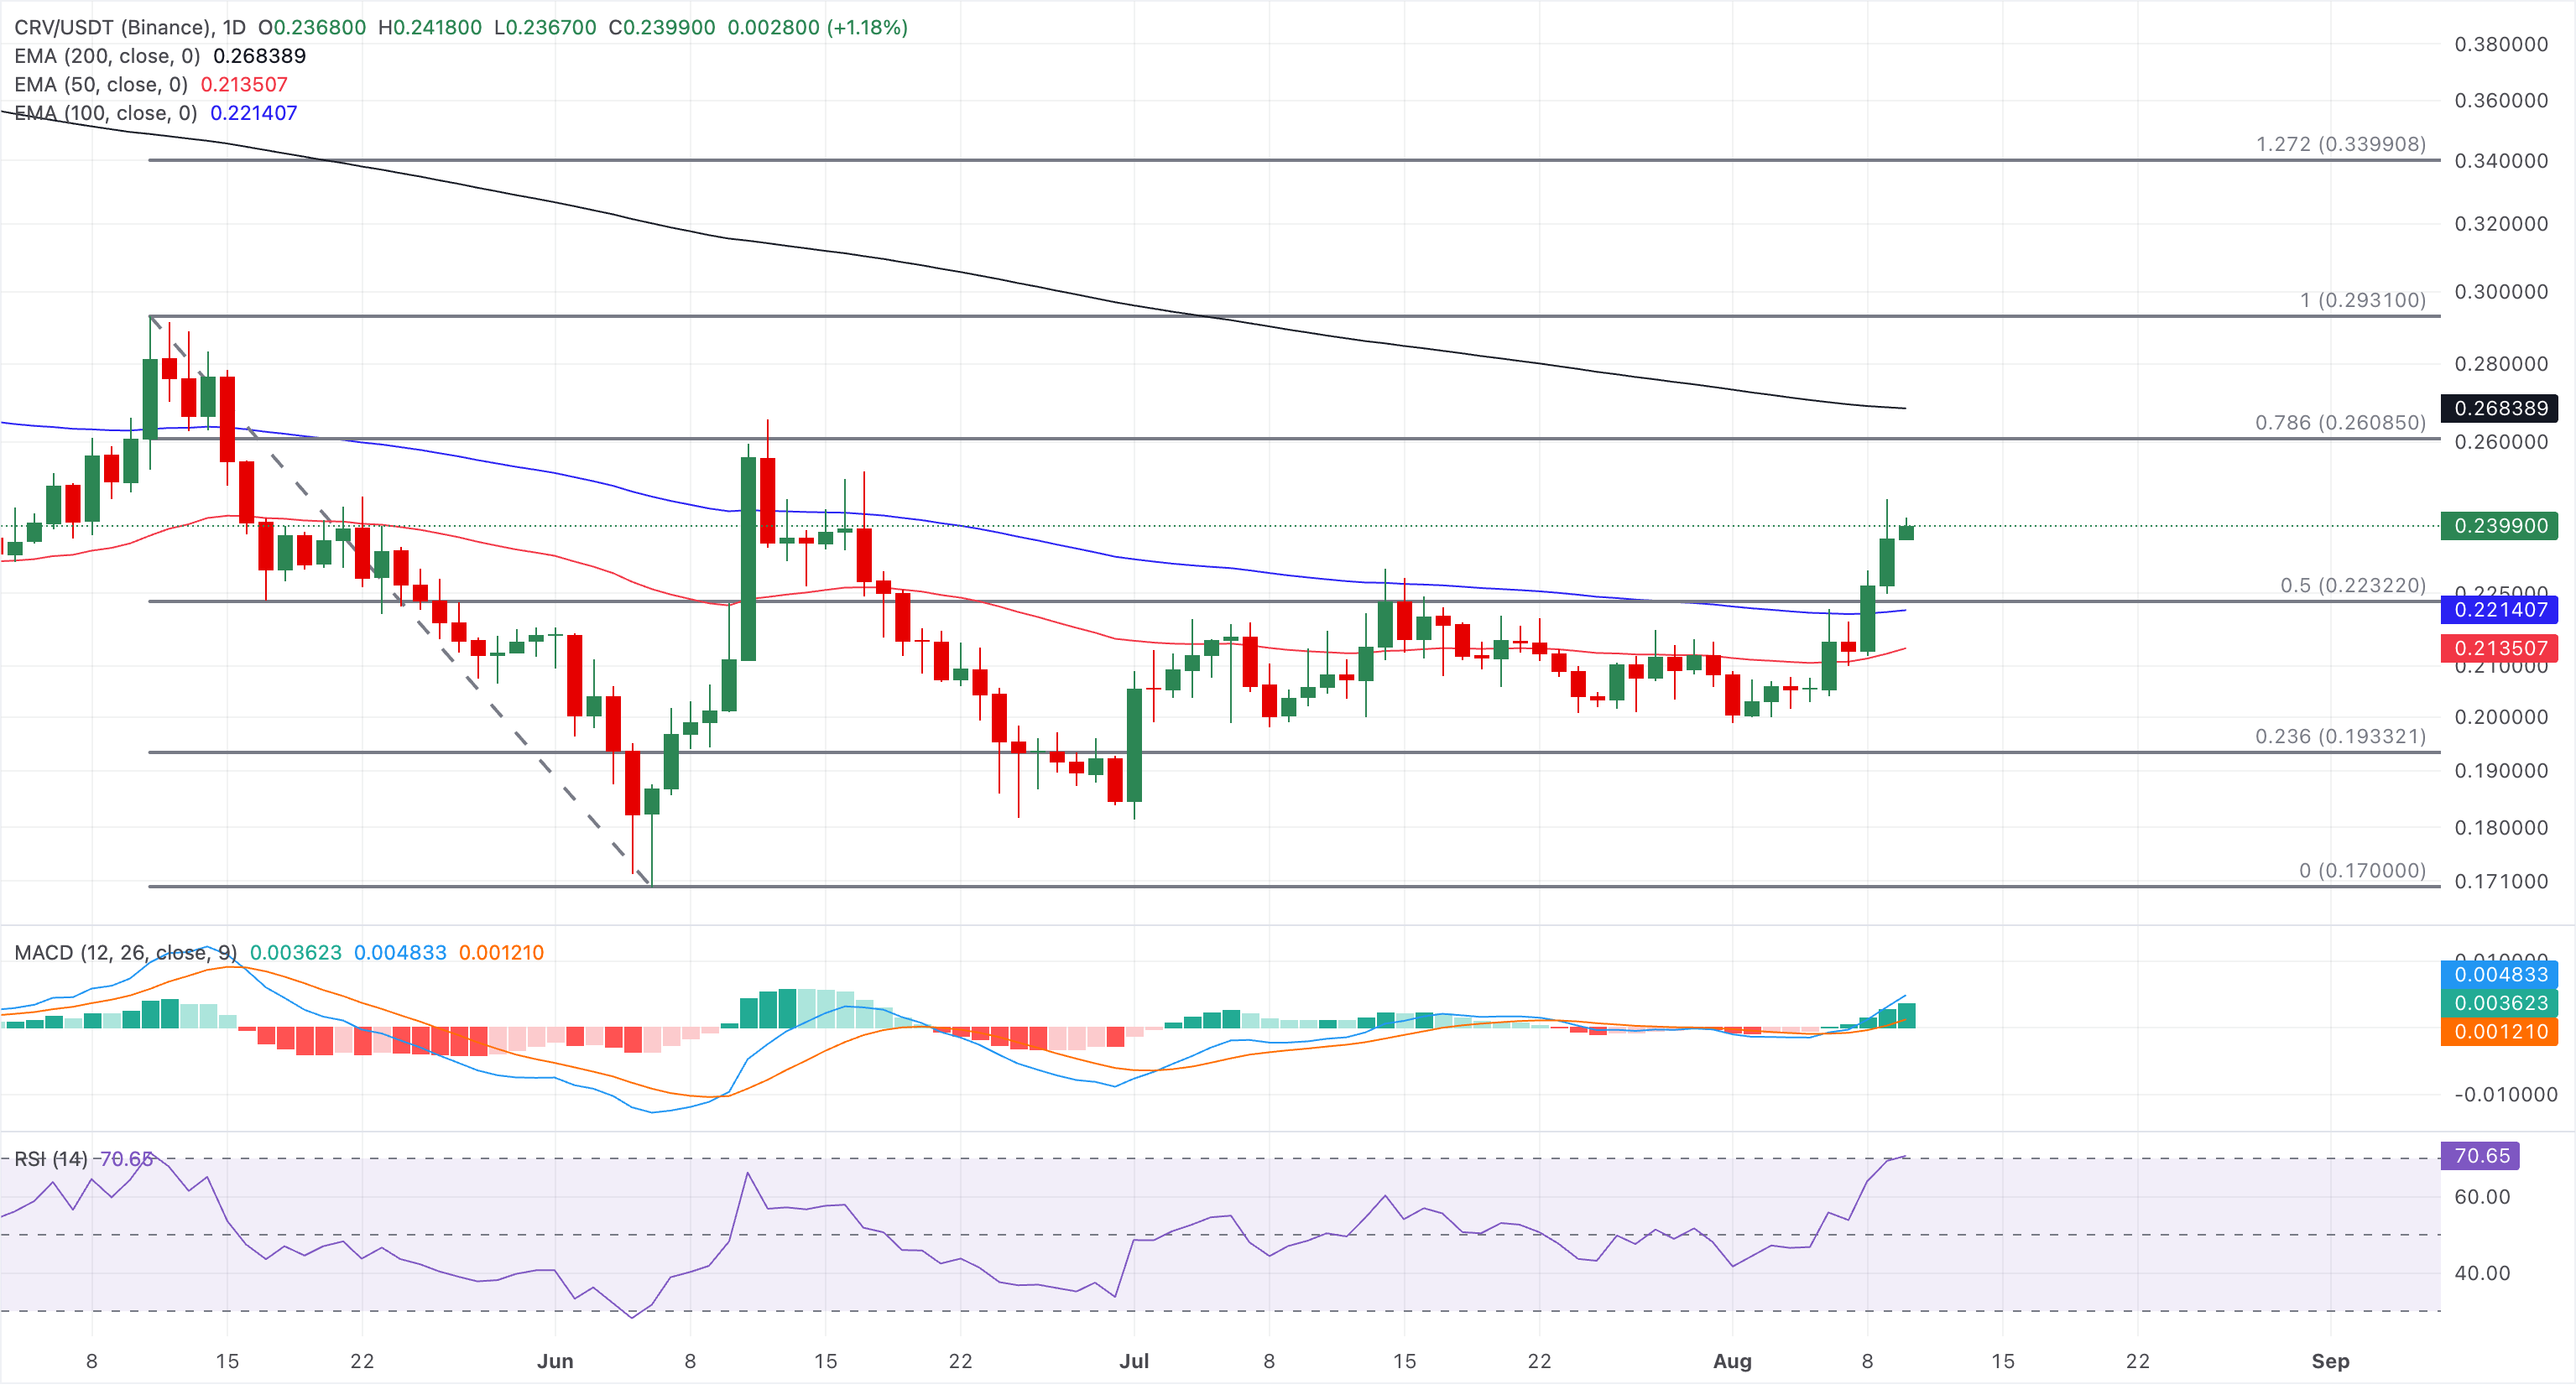
On the downside, the 50% retracement level at $0.2232 is reinforced by the reclaimed short-term EMAs, with the 100-day EMA at $0.2214 and the 50-day EMA at $0.2135.
(The technical analysis of this story was written with the help of an AI tool. Know more.)
Recommended Articles








Comments (0)
Click the $ button, enter the symbol, and select to link a stock, ETF, or other ticker.