


Ethereum Weekly Forecast: Calm before a bullish breakout



- Ethereum price has been consolidating between the 50-day and 100-day EMA levels since July 16.
- US-listed spot ETFs recorded an inflow through Thursday, pointing to the fifth consecutive week of positive flows.
- On-chain data shows large ETH holders are accumulating despite broader market weakness.
Ethereum (ETH) continues to trade sideways, hovering around $1,901 on Friday, hinting at a potential breakout ahead. Meanwhile, steady Exchange Traded Funds (ETFs) inflows and rising accumulation among large ETH holders suggest that bullish pressure could be building beneath the surface.
Persistent institutional demand
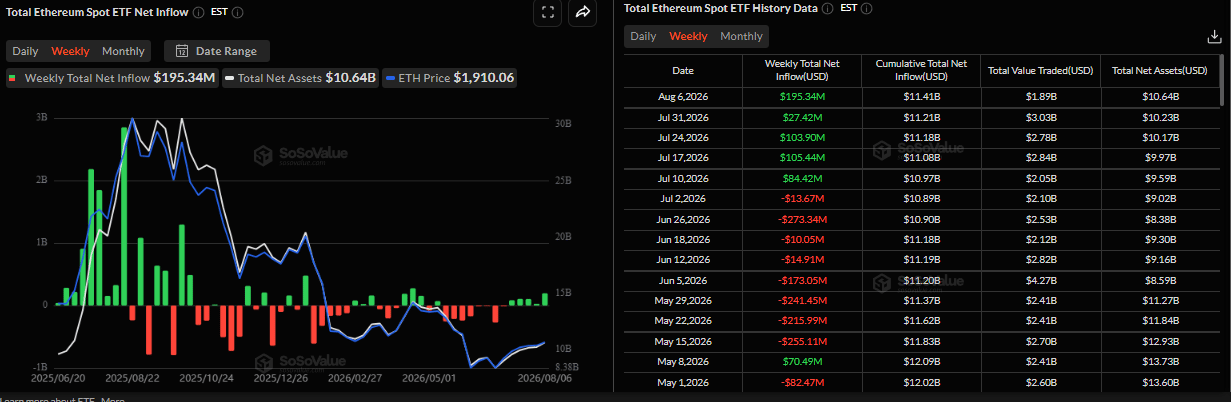
Institutional demand continues to strengthen. SoSoValue data shows that US-listed spot ETH ETFs have recorded an inflow of $195.34 million through Thursday. If Friday shows positive flow, ETH is about to enter its fifth week of steady inflows. These positive flows suggest institutional investors are gradually returning to the market, which could support ETH.
On-chain perspective: Large cohorts buy, small ones sell
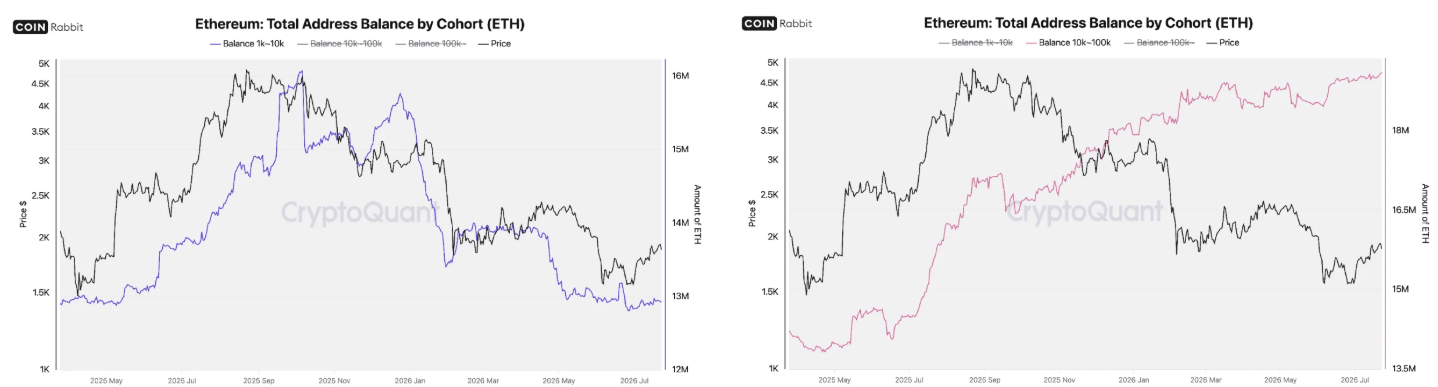
CryptoQuant report this week showed a clear divergence between the large and small cohorts’ wallets. The chart below shows that the (1K–10K) ETH cohort (left chart) peaked near 15.6 million in January and has since fallen to roughly 12.9 million, still net distributing through the bear market. Meanwhile, the (10K–100K) balance cohort (right chart) has accumulated relentlessly, rising from about 14 million in mid-2025 to record highs near 19.6 million on Wednesday.
Similarly, whales (100K+ ETH) have led the accumulation, adding roughly 1.8 million ETH since mid-2025. Overall, this indicates that the largest holders are absorbing the supply that smaller wallets are releasing, which is “Smart money accumulating ETH”.
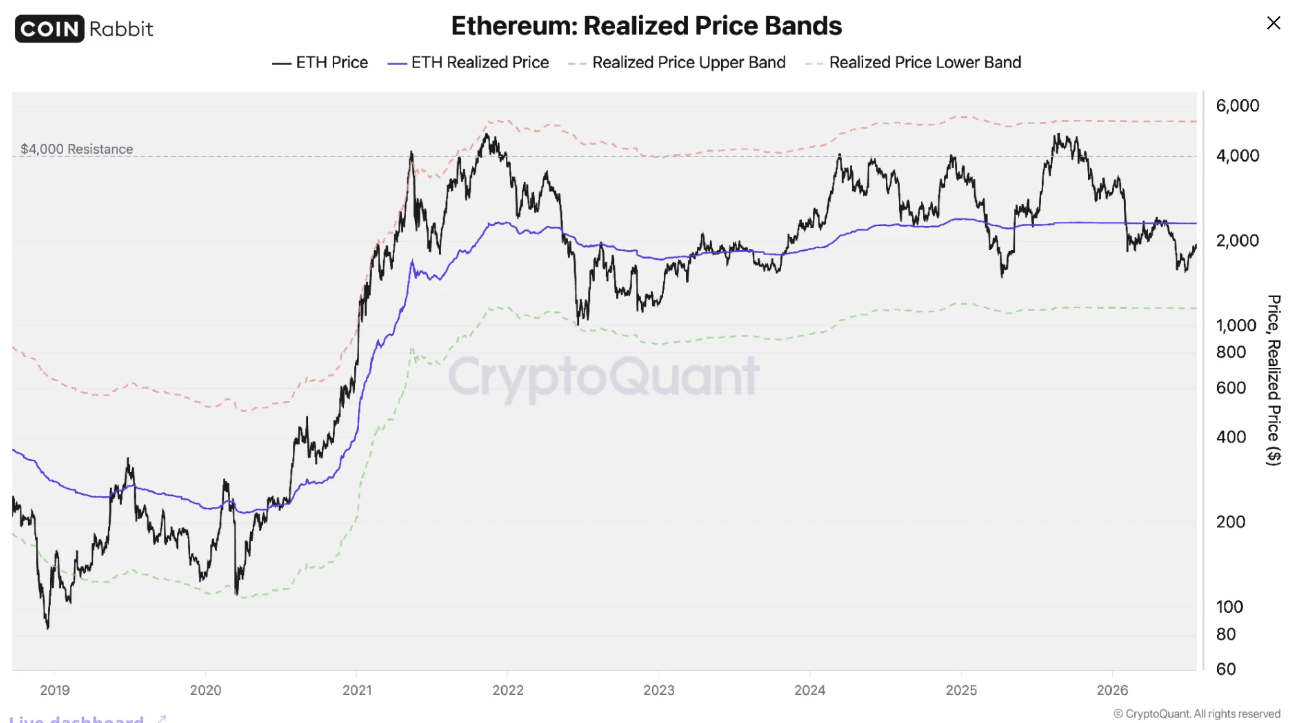
In addition, Realized Price Bands show that Ethereum, at about $1,900, trades below its realized price of $2,450, the most stretched of the three, near the lower half of its band.
“Indeed, ETH bottomed in early 2025 at a similar price level and distance from its lower band realized price,” reported CryptoQuant’s analyst.
Ethereum technical outlook: Fading bearish pressure
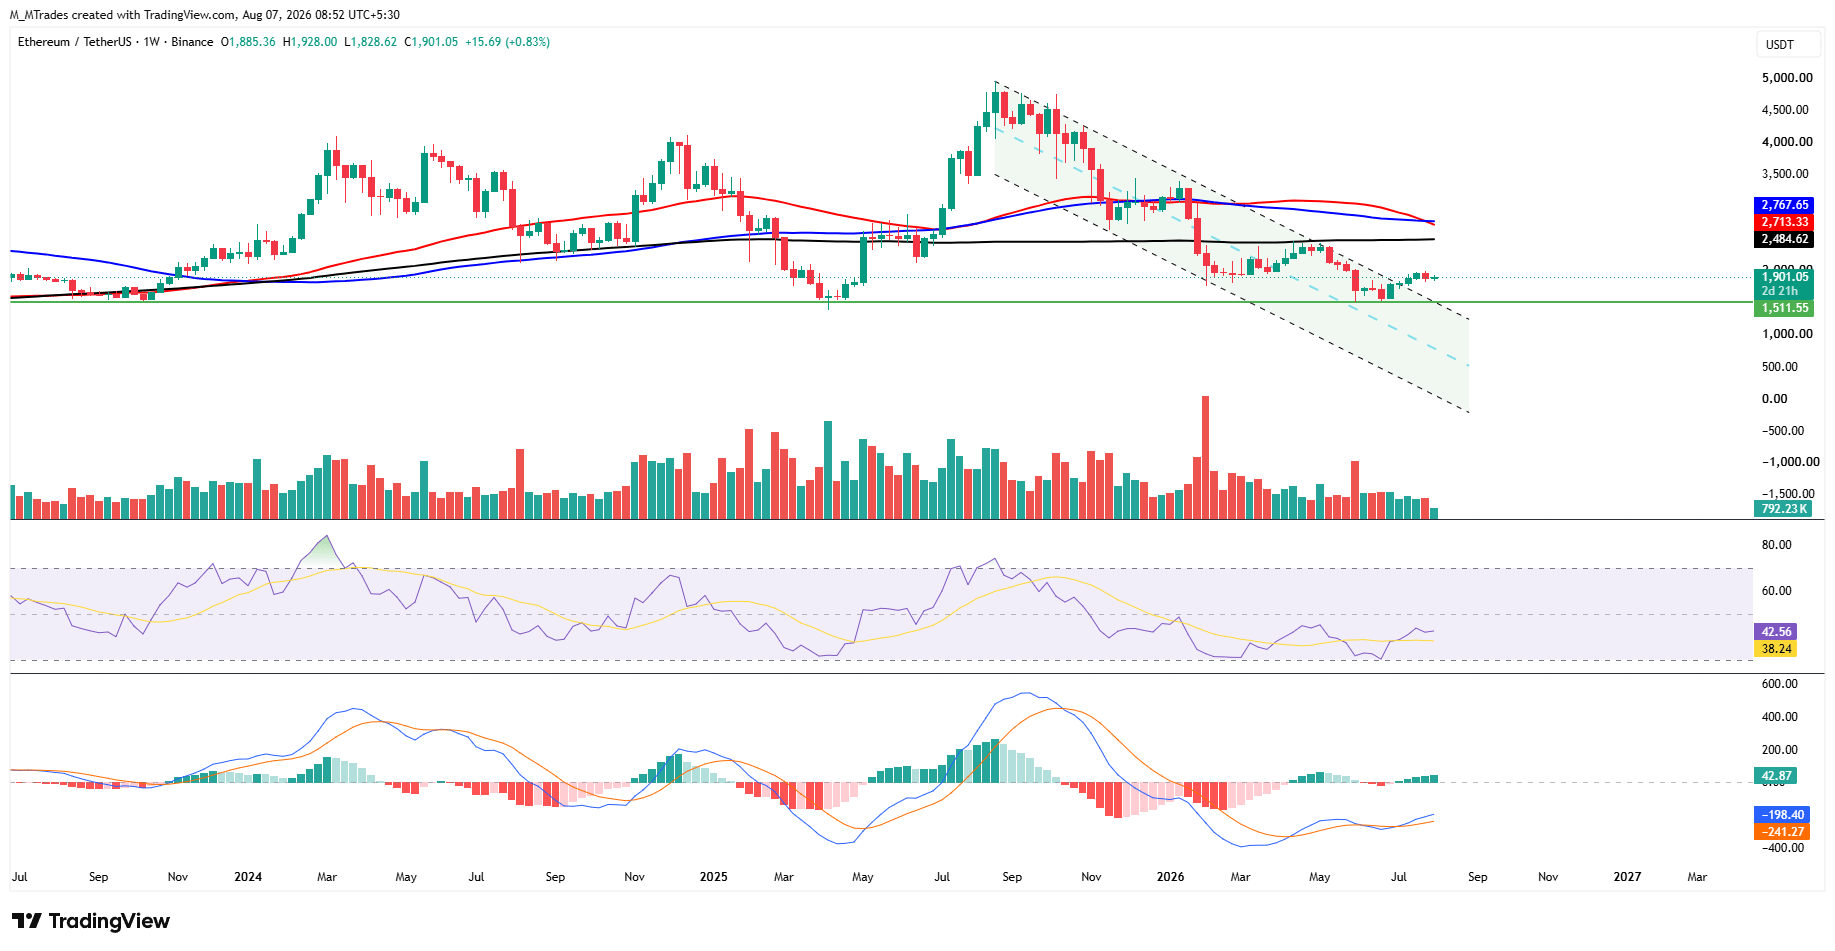
Ethereum price trades slightly up so far this week, trading around $1,901 at the time of writing on Friday after a mild correction of 3.55% in the previous week. ETH price trades below the key Simple Moving Averages (SMAs) on the weekly chart, highlighting a broader bearish trend, but it broke above a falling parallel channel (drawn by joining multiple highs and lows since mid-August 2025) in mid-July, suggesting bullish momentum is beginning to emerge.
If ETH continues its recovery, it could extend the advance toward the 200-week SMA at $2,484.
Momentum indicators on the weekly chart show mild signs of easing bearish sentiment. The Relative Strength Index (RSI) is trending higher toward the neutral 50 level, with a reading of 42 on Friday. Meanwhile, the Moving Average Convergence Divergence (MACD) flipped to a bullish crossover in early July and remains intact, with rising green histogram bars, supporting a positive outlook.
However, if ETH corrects, it could extend the decline toward the key support level around $1,511.
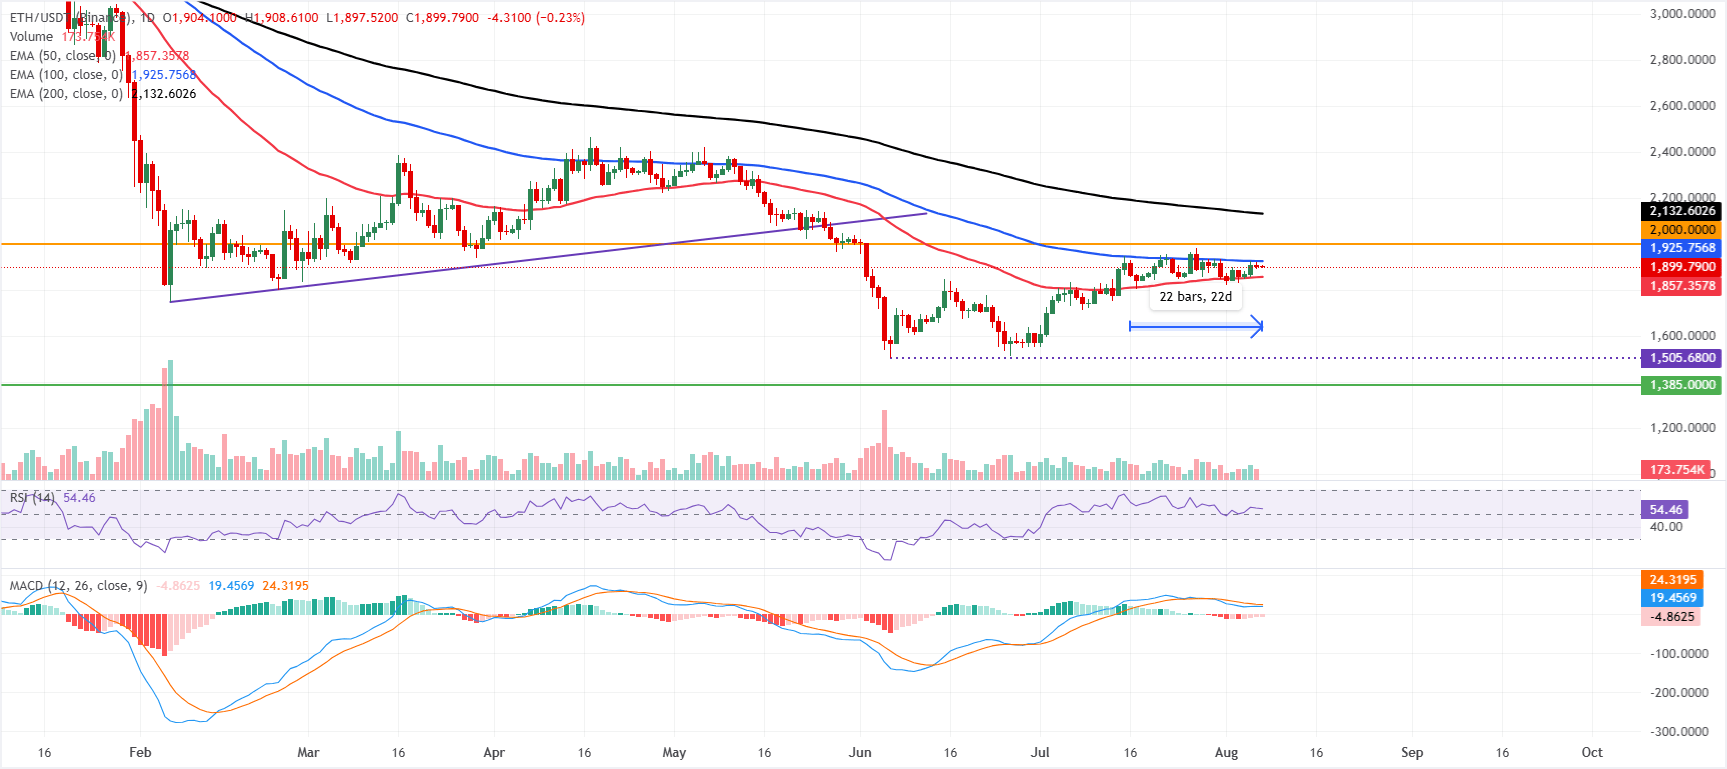
On the daily chart, ETH has been trading sideways for the last 22 days between the 50-day EMA at $1,857 and the 100-day EMA at $1,925, keeping the near-term tone neutral.
Meanwhile, the 200-day EMA at $2,132 sits well overhead and reinforces the broader corrective backdrop, while the RSI around 54 hints at moderate, rather than impulsive, bullish momentum. The MACD indicator stays below zero, suggesting upside attempts could continue to face supply against the cluster of medium- and long-term averages.
On the topside, immediate resistance is located at the 100-day EMA near $1,925, with a stronger barrier at the psychological and chart level of $2,000 before the 200-day EMA at $2,132 comes into focus.
On the downside, initial support is provided by the 50-day EMA at $1,857, with a deeper technical floor seen at the horizontal level around $1,385 if selling pressure accelerates. As long as ETH trades between the $1,857–$1,925 band, price action is likely to remain directionless, awaiting a clear break to define the next trending phase.
(The technical analysis of this story was written with the help of an AI tool. Know more.)
Recommended Articles








Comments (0)
Click the $ button, enter the symbol, and select to link a stock, ETF, or other ticker.