


Major Altcoins Price Forecast: XRP, ADA and SOL remain vulnerable as bearish grip tightens



- Ripple trades in red for the fourth consecutive day, capped below a descending resistance trendline near its 50-day EMA at $1.1575.
- Cardano remains in a downward trend for the tenth day on Tuesday as selling pressure resurfaces.
- Solana edges below its 50-day EMA at $76.59 as momentum signals a neutral-to-bearish transition.
Major altcoins in the crypto market, such as Ripple (XRP), Cardano (ADA), and Solana (SOL), are trading in the red on Tuesday, extending their 2% to 3% decline from the previous day. The technical outlook for XRP, ADA, and SOL shows a near-term bearish bias, with prices trending below their respective 50-day Exponential Moving Averages (EMAs).
XRP remains vulnerable to deeper losses
XRP nears the $1.00 psychological threshold at press time on Tuesday, maintaining a steady decline as the 50-day EMA and a declining resistance trendline capped recovery around $1.18 on July 4. XRP maintains a clear bearish configuration, heading toward the recent swing low of $1.00 from June 26.
From a technical perspective, a potential slip below $1.00 could target the 127.2% and 161.8% Fibonacci extension levels at $0.94 and $0.86, respectively, measured over the $1.29 to $1.00 downswing.
Momentum is losing strength on the daily chart, with the Relative Strength Index (RSI) at 39, reflecting a downward trend, while the Moving Average Convergence Divergence (MACD) risks crossing below its signal line as buying pressure wanes.
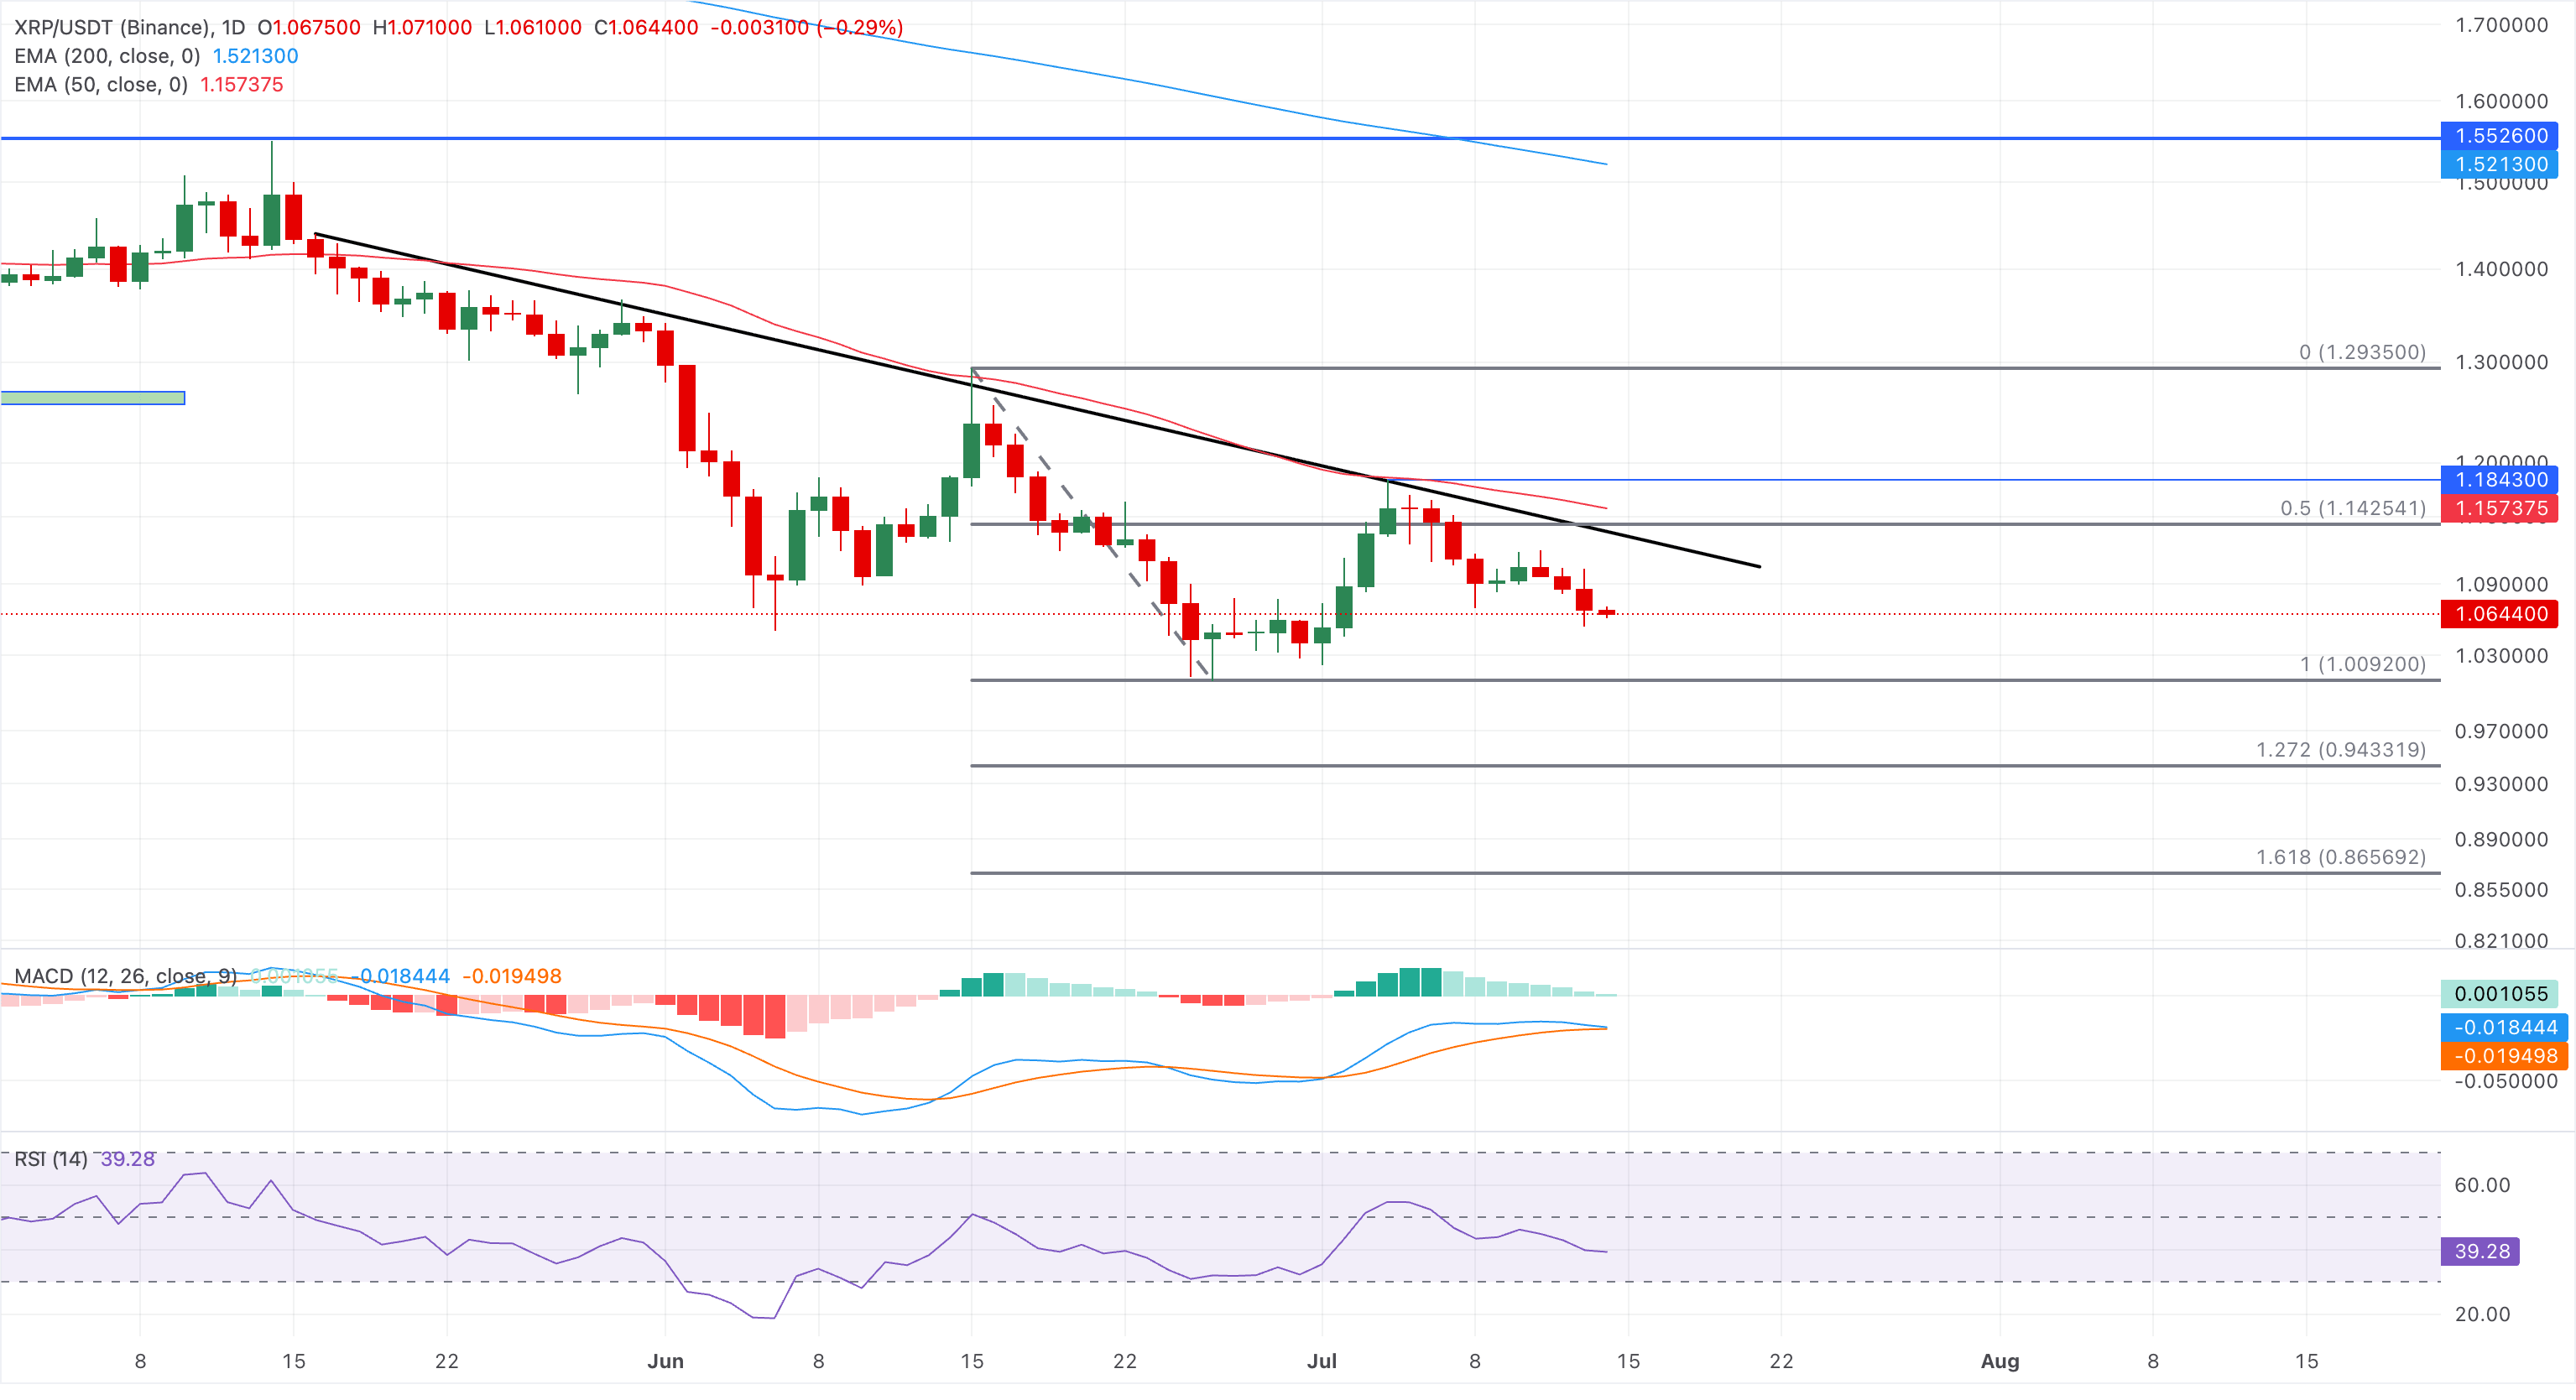
On the topside, initial resistance is seen at the overhead trendline near the 50% retracement at $1.14, reinforced by the 50-day EMA at $1.15.
Cardano at risk of erasing early July gains
Cardano trades in the red on Tuesday, maintaining a near-term decline over the last 10 days. The 50-day EMA at $0.1802, well below the 200-day EMA at $0.2812, keeps the altcoin capped in the short term.
The RSI at 40 has dipped below its midline, hinting at renewed downside momentum, while the MACD and signal line risk a bearish crossover amid flattening histogram bars.
On the downside, the swing low at $0.1385 from June 26 emerges as the crucial support level in sight.
Looking up, the 50-day EMA at $0.1802 remains a key dynamic barrier, guarding the upside to the $0.2000 psychological threshold.
Solana drops below its 50-day EMA amid mounting selling pressure
Solana trades below $75.00 at press time on Tuesday, keeping a bearish near-term tone as it holds beneath the 50-day EMA at $76.66 and the 200-day EMA at $97.65. From a technical perspective, the key support for SOL is at the $67.50 horizontal level, which helped trigger a rebound on June 26.
The MACD has crossed below its signal line, triggering a fresh wave of bearish histograms, while the RSI at 46 falls below the midline. Taken together, they suggest waning buying pressure as sellers regain strength.
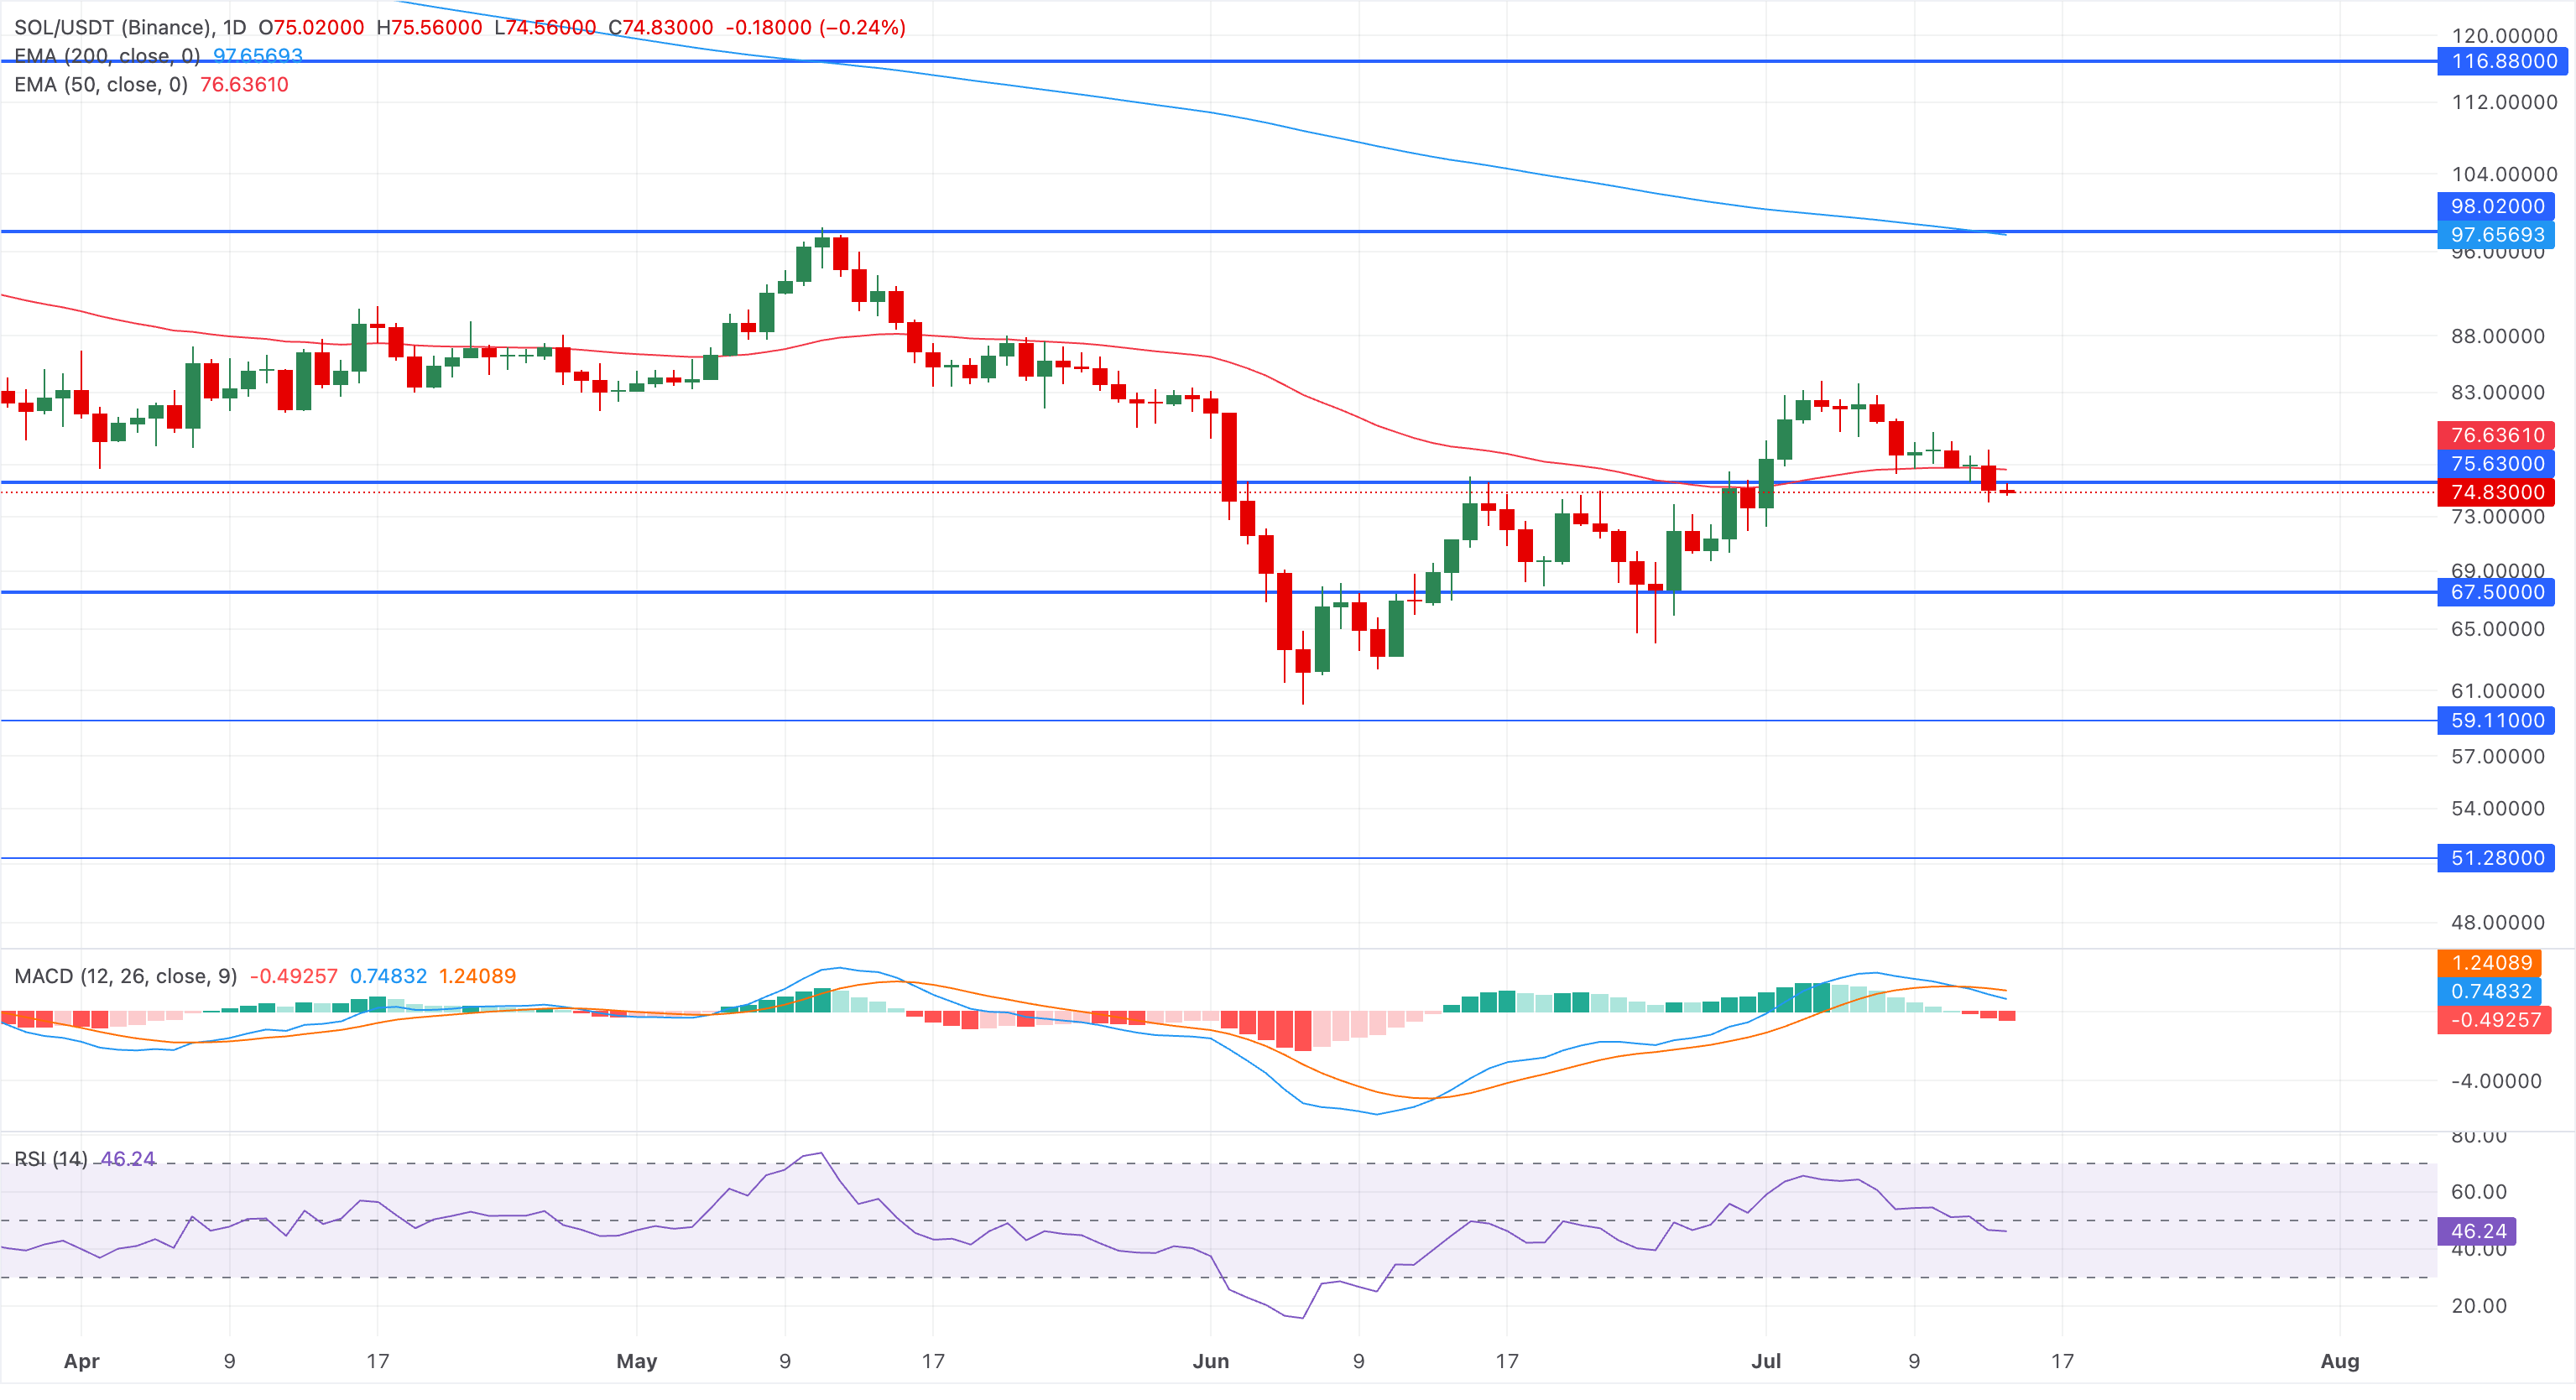
On the flip side, initial resistance is at the 50-day EMA near $76.63, followed by the longer-term 200-day EMA at $97.65.
(The technical analysis of this story was written with the help of an AI tool. Know more.)
Recommended Articles







Comments (0)
Click the $ button, enter the symbol, and select to link a stock, ETF, or other ticker.