


Ripple and Stellar outlook: XRP defends critical support, XLM extends recovery



- XRP steadies around the key $1.00 psychological level on Tuesday, as traders await the next directional catalyst.
- XLM extends its recovery, trading above $0.178 after a mild recovery the previous day.
- Mixed on-chain and derivatives metrics for both altcoins signal growing market indecision and a lack of clear directional conviction.
Ripple (XRP) trades around the key $1.00 psychological level on Tuesday, consolidating as the token awaits its next directional catalyst. Stellar (XLM) extends its recovery above $0.178 after posting modest gains at the start of this week. Despite recent stabilization, mixed on-chain and derivatives data across both altcoins indicate cautious market sentiment, suggesting traders remain indecisive about the sustainability of the recovery.
Mixed on-chain outlook
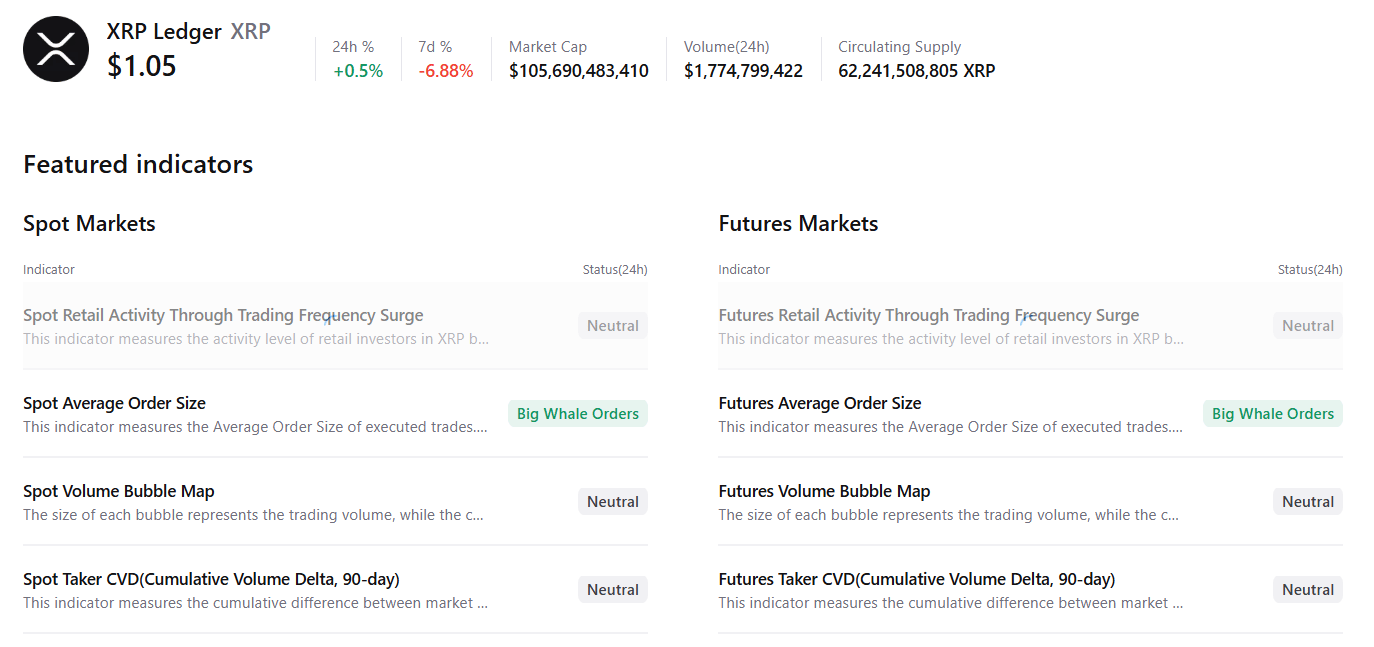
CryptoQuant’s summary data shows mixed sentiment. XRP’s spot markets show large whales' orders with neutral conditions in other metrics, supporting a potential recovery.
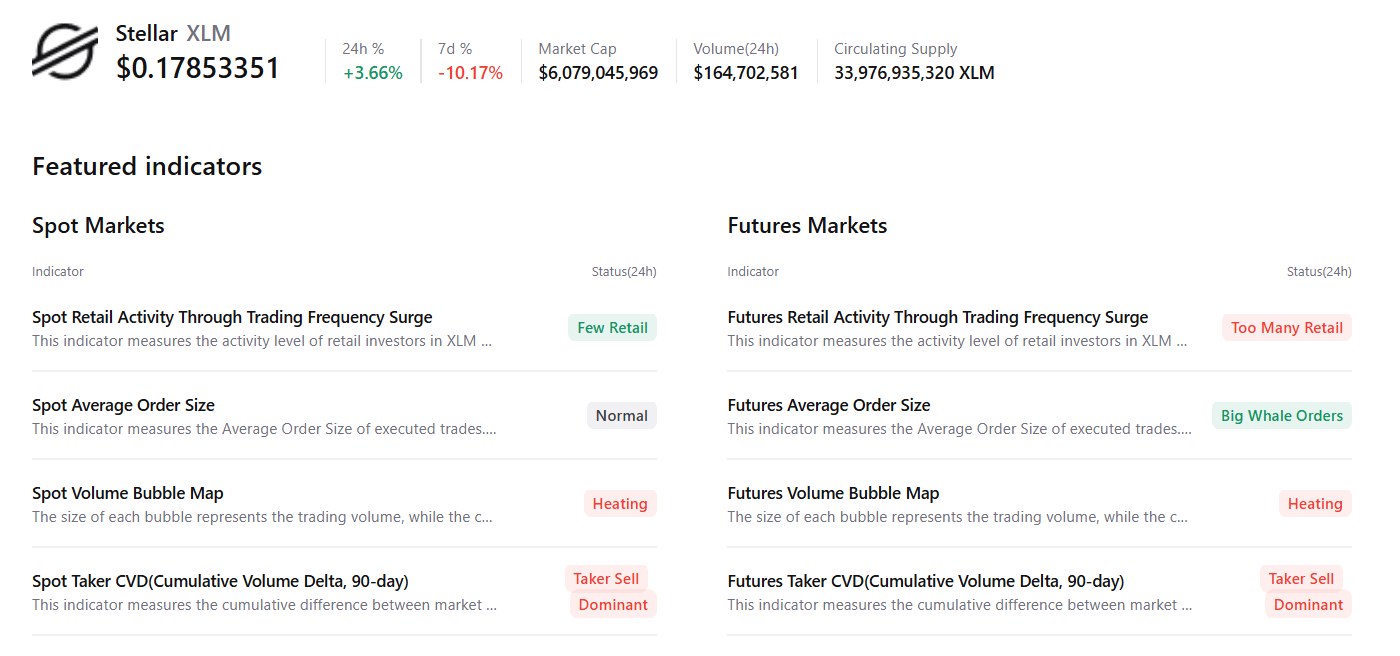
However, XLM shows an overheating condition and selling-side dominance in the spot and futures markets, with mixed retail activity, hinting at cautious sentiment among traders and capping any potential recovery.
Derivatives metrics suggest cautious sentiment
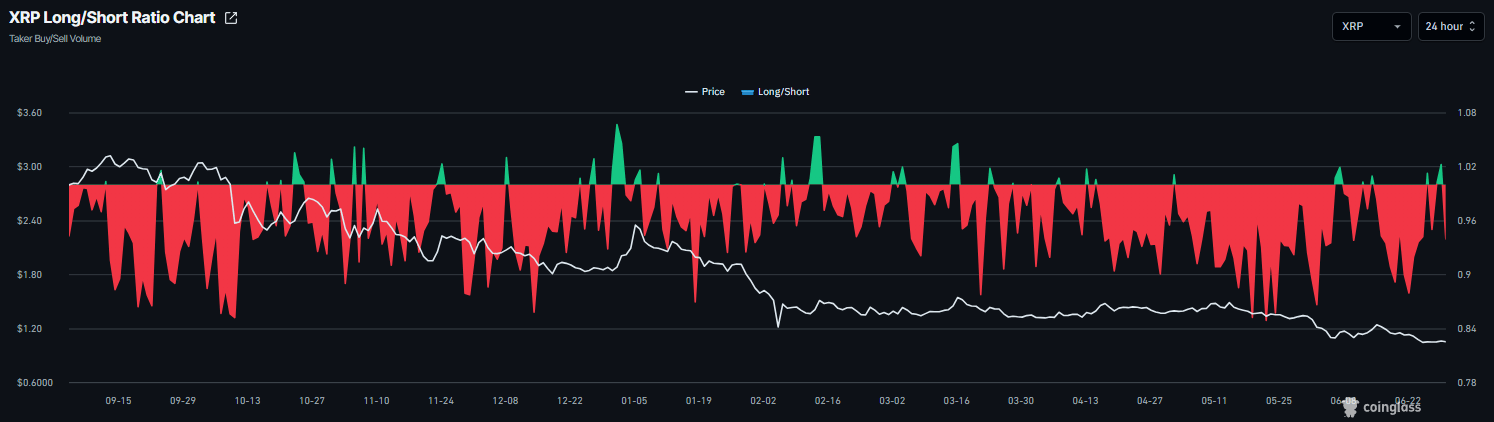
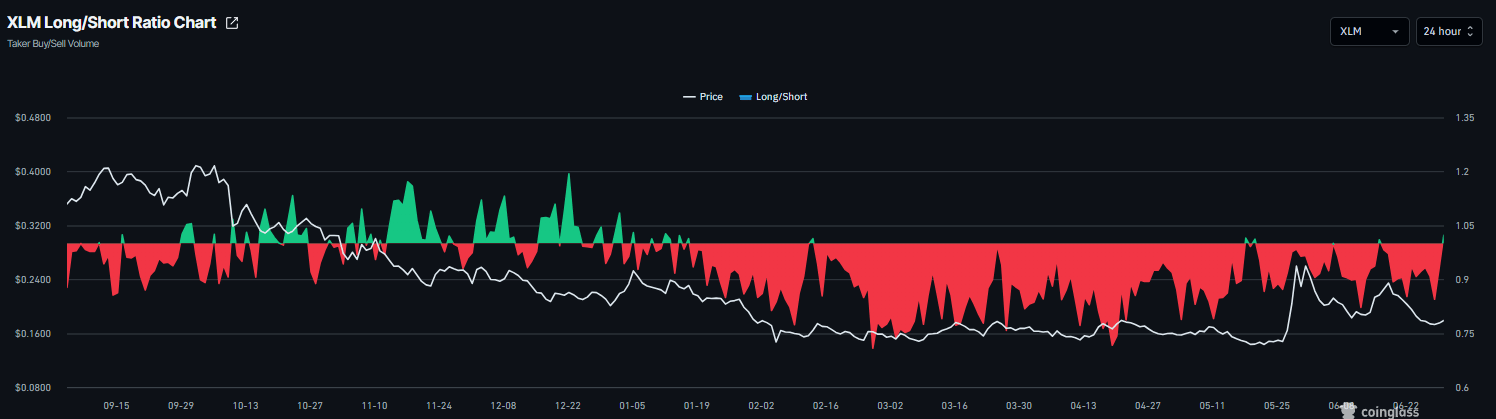
Derivatives data shows a mixed outlook. CoinGlass’ long-to-short ratio for XRP read 0.93 on Tuesday, slipping toward bearish territory. However, XLM reads 1.02 during the same period, flipping into bullish territory.
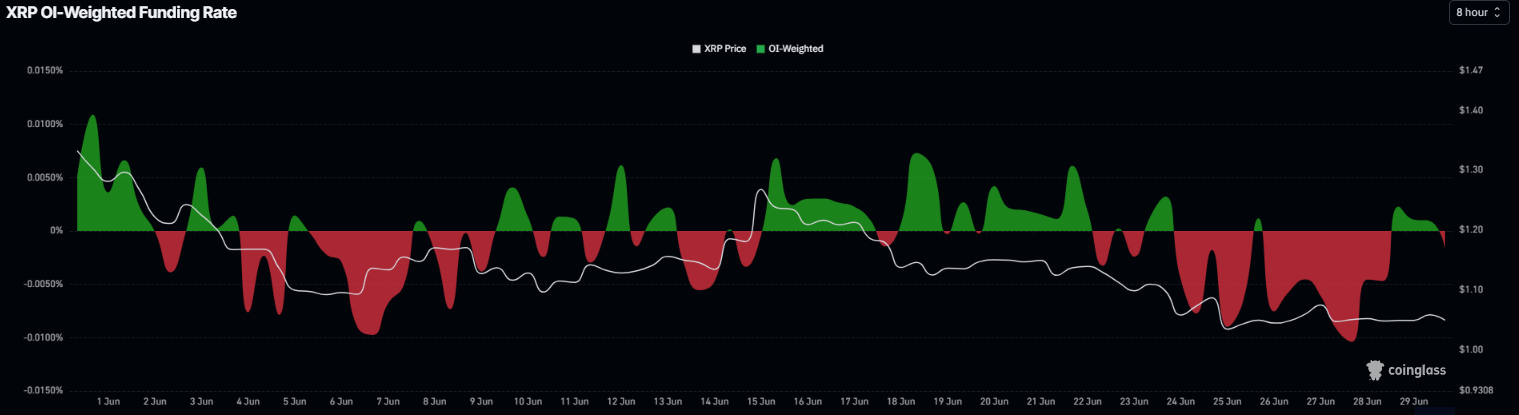
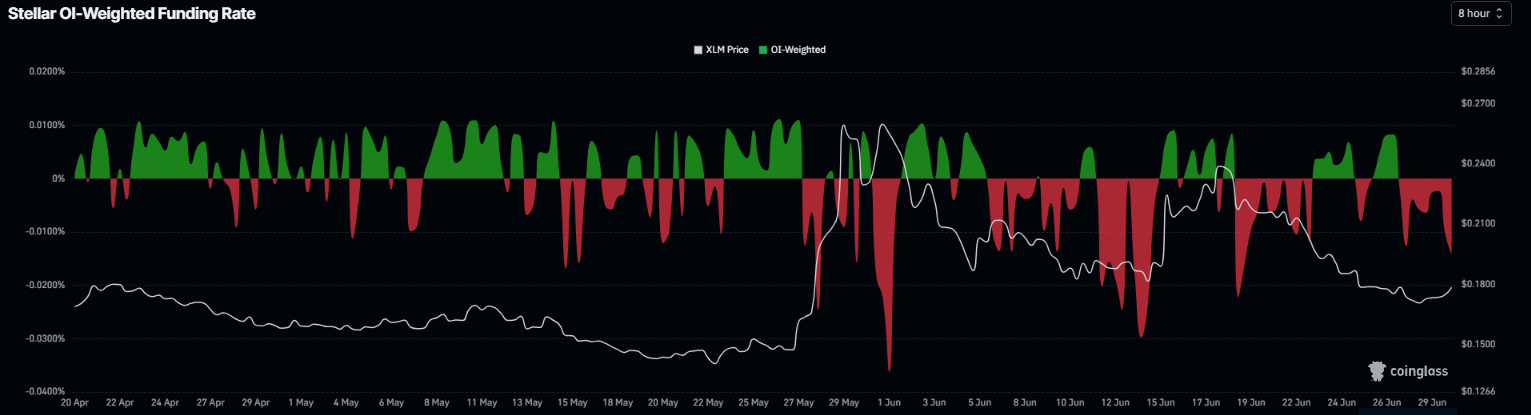
In addition, XRP funding rates turned negative on Tuesday, reading -0.0016%. For XLM, funding rates flipped negative on Saturday, reading -0.0143% on Tuesday, indicating that shorts are paying longs and suggesting bearish sentiment.
Some other signs of optimism
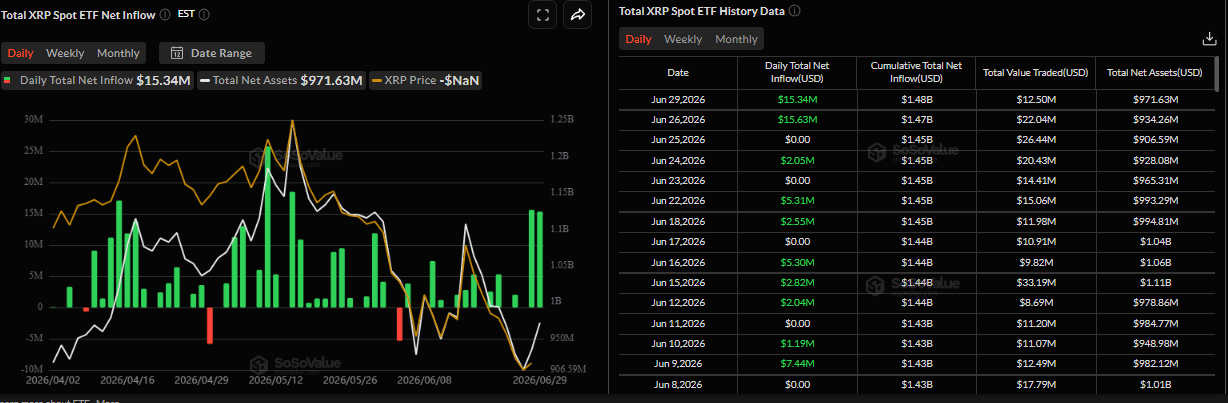
SoSoValue data shows some signs of optimism. Spot Exchange Traded Funds (ETFs) recorded an inflow of $15.34 million on Monday after a $15.63 million inflow on Friday last week. If this inflow trend continues and intensifies, XRP could see a recovery ahead.
XRP technical outlook: Stabilizes around key support zone
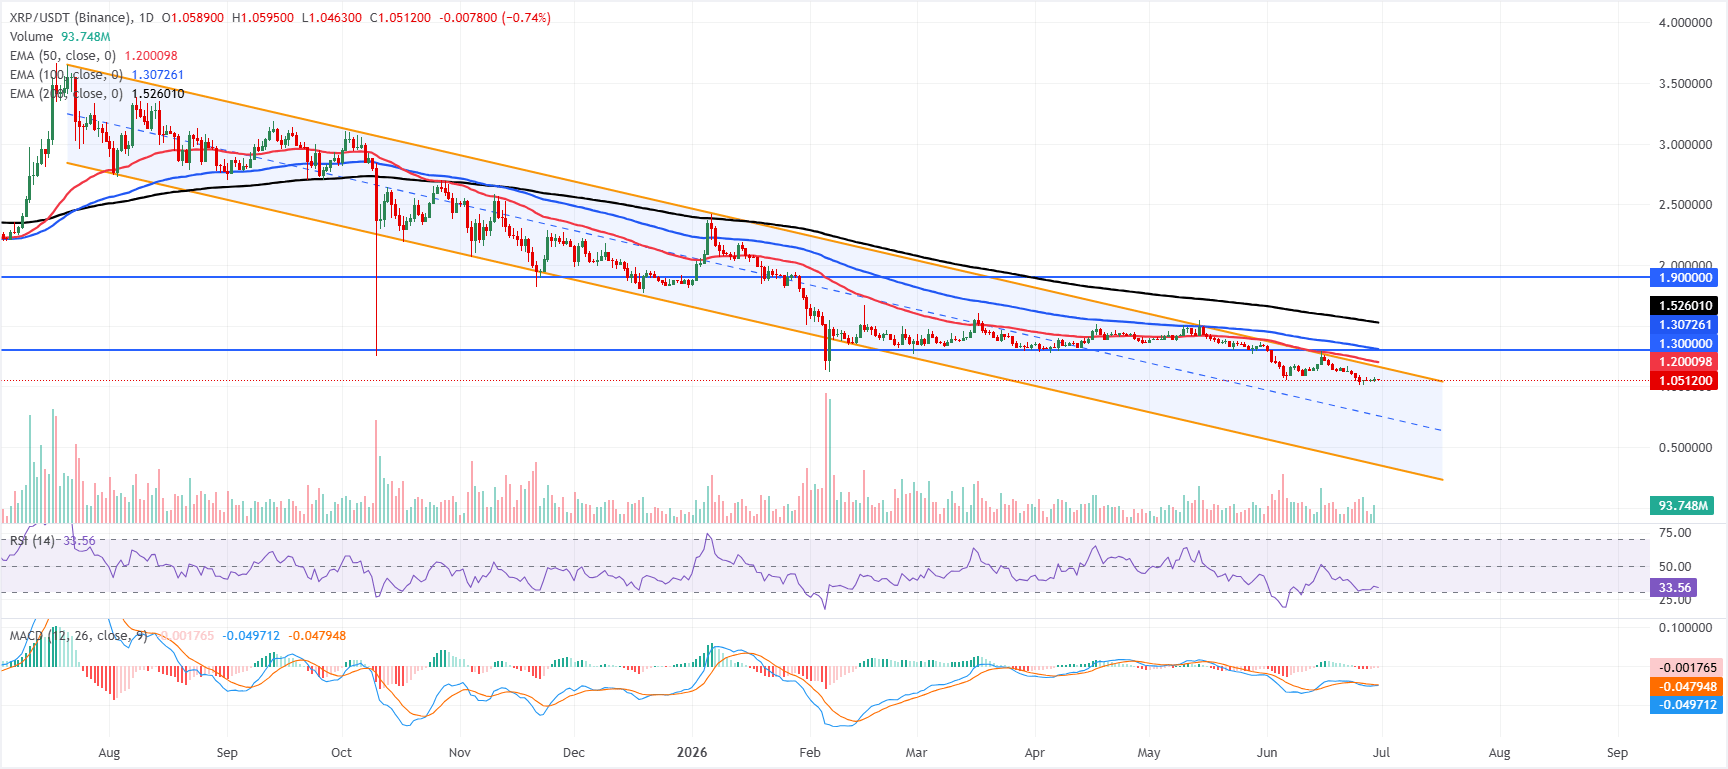
XRP price trades at $1.051 on Tuesday, stabilizing around the key $1.000 psychological level for the past four days. Despite this recent consolidation, XRP maintains a bearish bias as price remains well below the 50‑day, 100‑day, and 200‑day Exponential Moving Averages (EMAs) at $1.200, $1.307, and $1.526, respectively.
XRP also trades under the upper boundary of the downward parallel channel at $1.162, reinforcing a capped structure. At the same time, the Relative Strength Index (RSI) at 33 stays in weak territory and the Moving Average Convergence Divergence (MACD) remains slightly negative, hinting that downside pressure still dominates.
On the topside, initial resistance appears at the channel boundary around $1.162, followed by the 50‑day EMA at $1.200. Higher up, the $1.300 horizontal barrier aligns with the 100‑day EMA at $1.307 to form a dense supply zone, ahead of the more distant 200‑day EMA at $1.526 and the major horizontal level at $1.900.
With no meaningful support levels defined below the market in the current dataset, any renewed selling could leave price vulnerable to discovering fresh demand zones at lower levels.
XLM technical outlook: Extends recovery
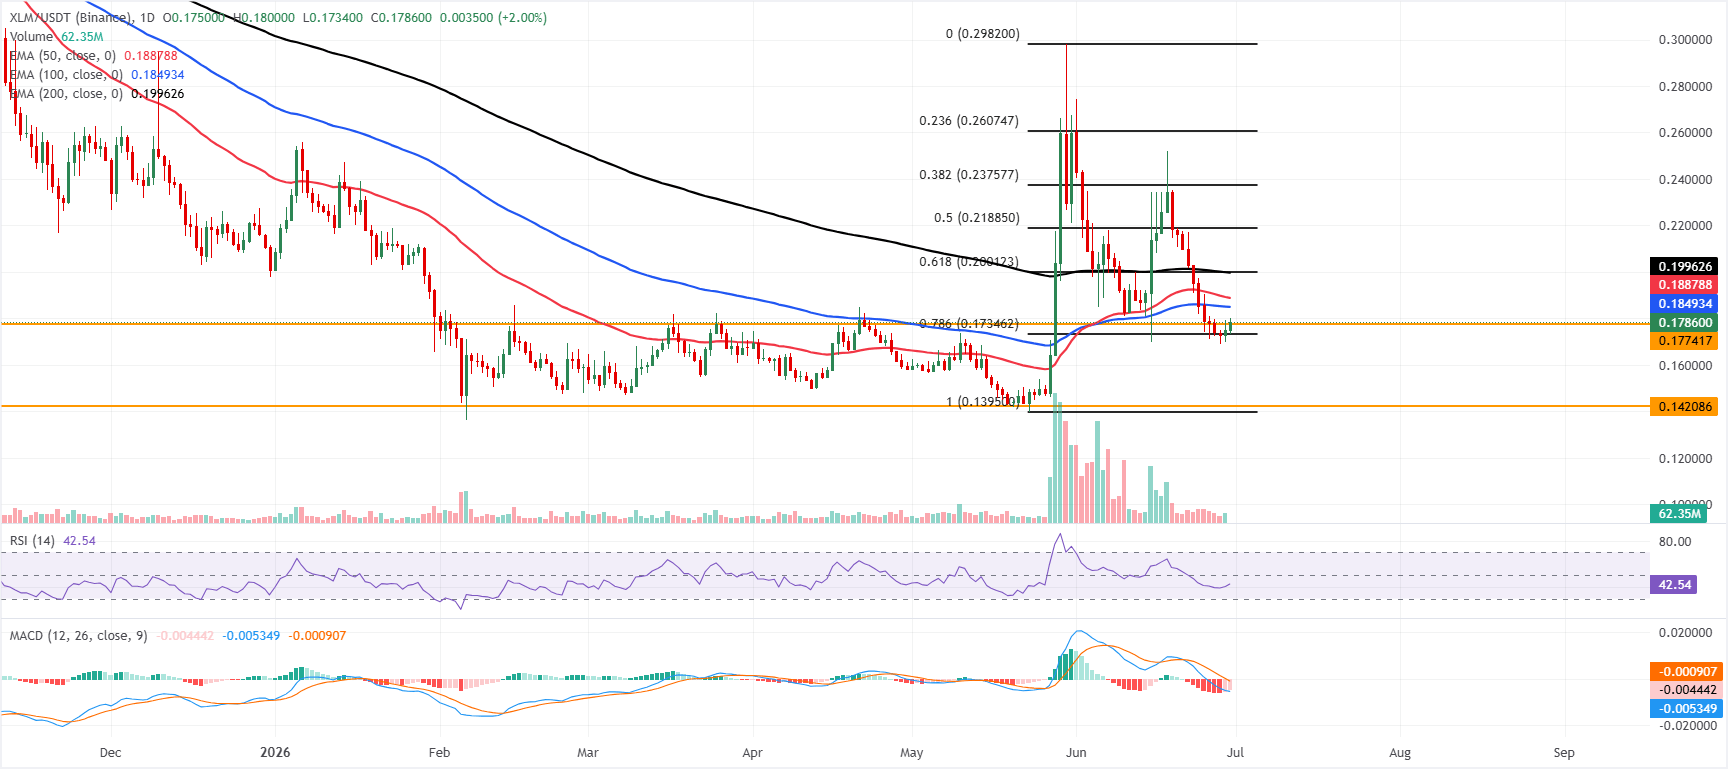
Stellar trades at $0.178 on Tuesday, extending its recovery. However, XLM is maintaining a bearish bias as price remains below the short- and medium-term EMAs. The 50-day EMA at $0.188, the 100-day EMA at $0.184 and the 200-day EMA at $0.199 all sit overhead as a layered supply zone, suggesting rallies are likely to be capped while these levels remain unreclaimed.
Momentum aligns with this cautious tone, as the RSI at 42 drifts below its midline and the MACD remains below zero, hinting at waning buying interest after the recent bounce.
On the downside, immediate demand is clustered just below the market at the horizontal support of $0.177, reinforced by the 78.6% Fibonacci retracement of the latest upswing at $0.173; a break below this area would expose the deeper horizontal floor near $0.142.
On the topside, initial resistance is located at the 100-day EMA at $0.184, followed by the 50-day EMA at $0.188; a sustained move above these EMAs would be needed to ease selling pressure, with further barriers emerging at the 200-day EMA at $0.199 and the 61.8% retracement at $0.200, ahead of higher Fibonacci levels at $0.218 and $0.237.
(The technical analysis of this story was written with the help of an AI tool.)
Recommended Articles







Comments (0)
Click the $ button, enter the symbol, and select to link a stock, ETF, or other ticker.