


Shiba Inu Price Forecast: SHIB attempts rebound after hitting historical low



- Shiba Inu springs up from its $0.00000405 record low, signaling a potential turnaround for the meme coin.
- SHIB’s attempt at recovery taps mild growth in retail interest, with futures Open Interest increasing to $31 million.
- Shiba Inu battles a dominantly bearish bias, defined by downward-sloping moving averages.
Shiba Inu (SHIB) is gaining momentum, trading around $0.00000419 at the time of writing on Monday. The meme coin’s knee-jerk rebound comes after hitting a new record low of $0.0000405.
If Shiba Inu maintains its current momentum and investor appetite strengthens, the token could experience a more robust rebound, potentially positioning the price for a sustained bullish trajectory over the long term.
Shiba Inu gains momentum as retail demand returns
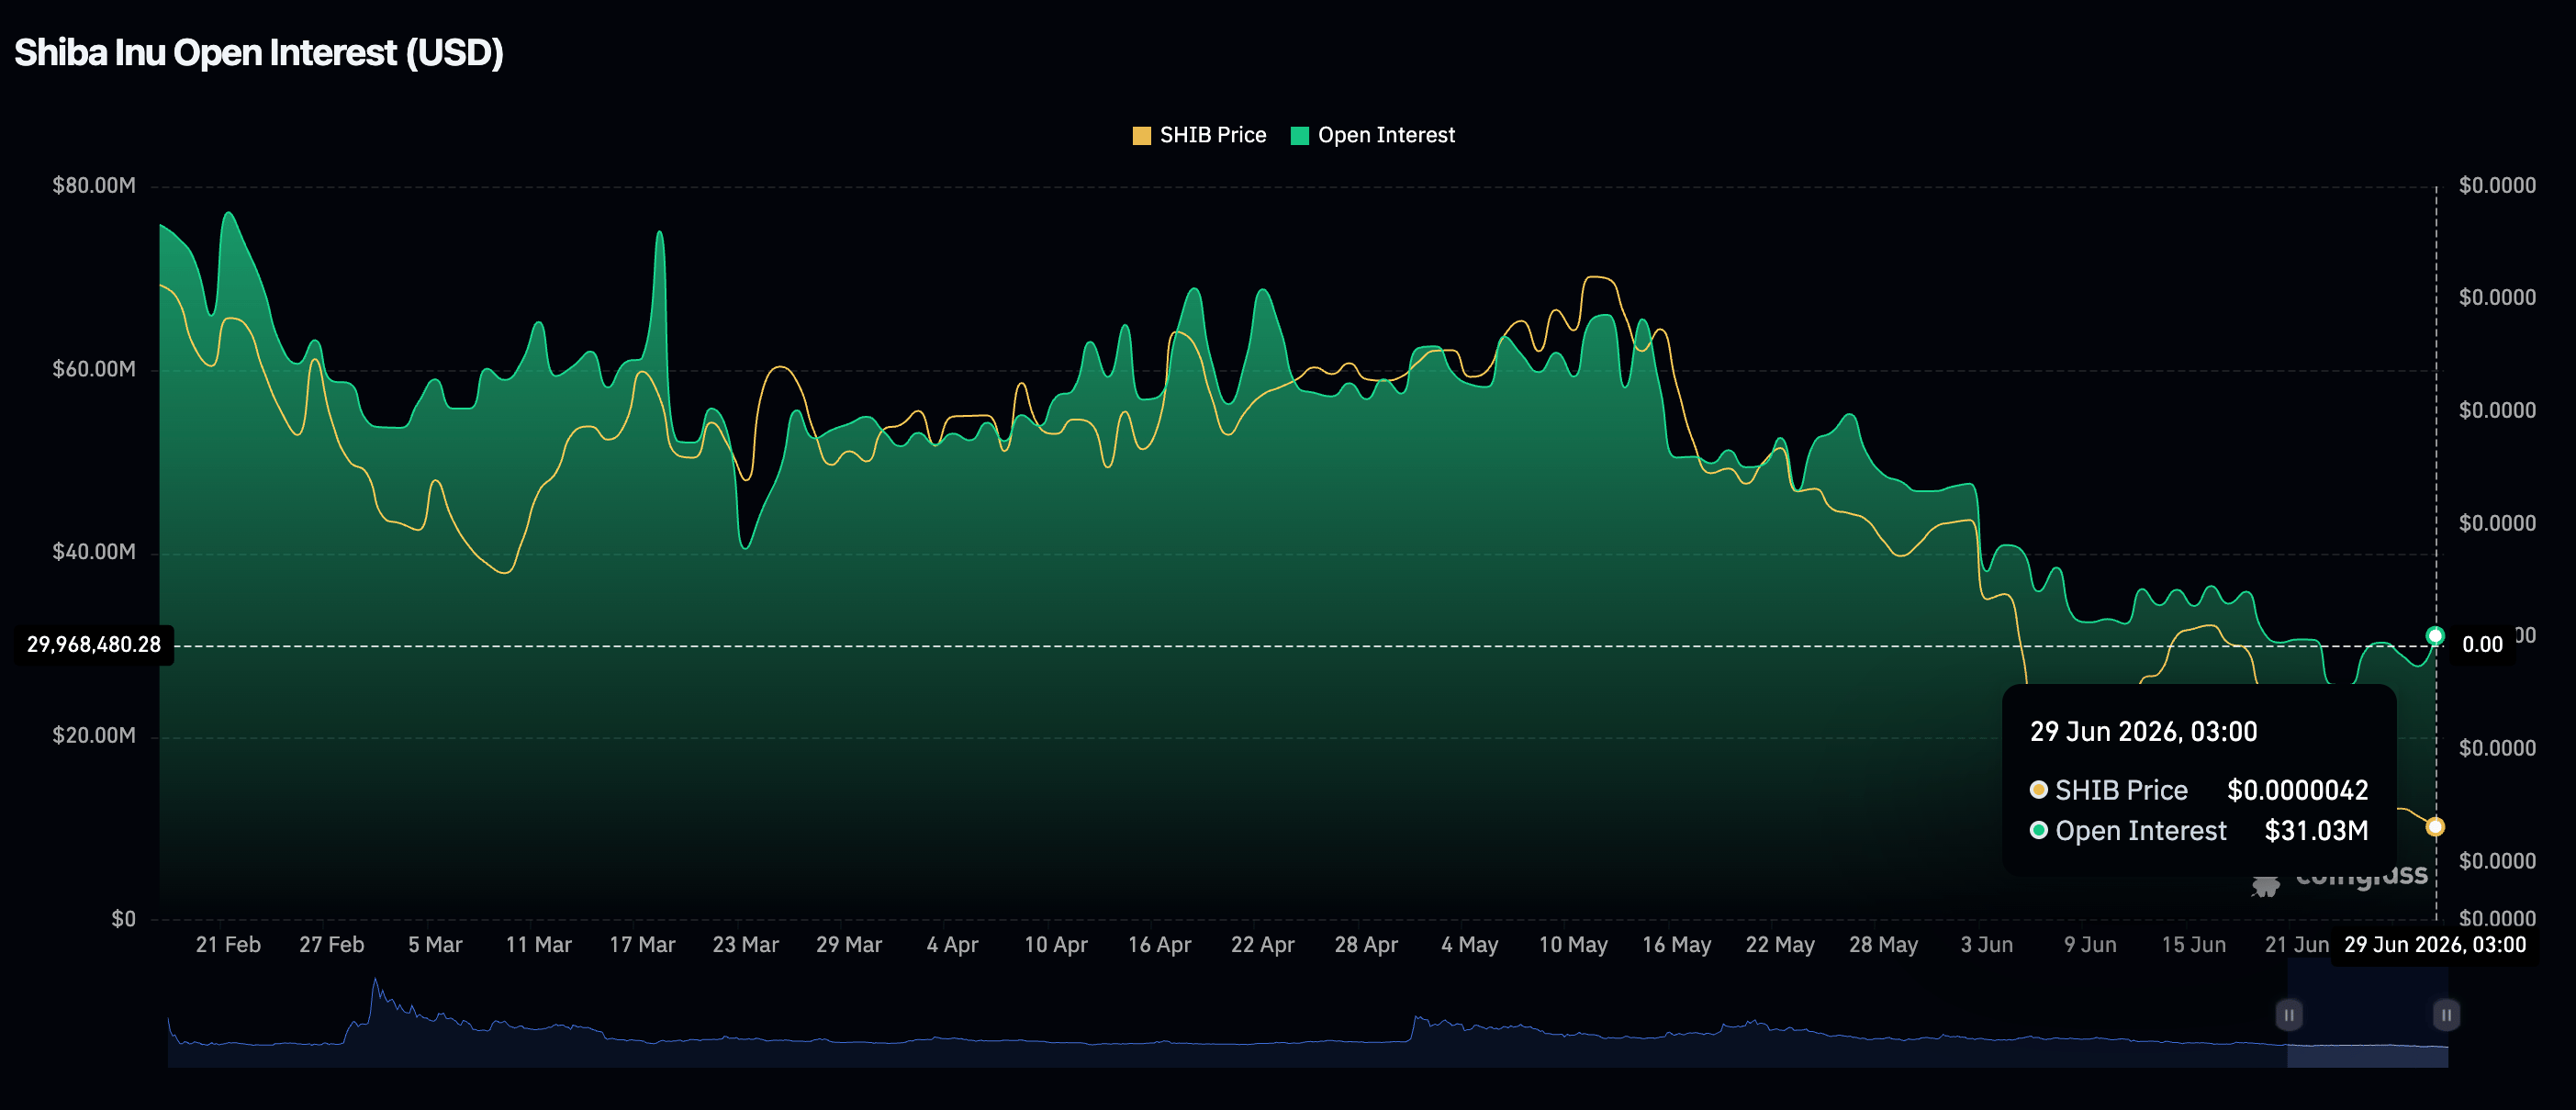
Shiba Inu derivatives market is broadly improving, as reflected in the perpetual futures Open Interest (OI) rising to $31 million on Monday, up from nearly $18 million the day before.
This uptick marks a possible broader uptrend following the OI's drop to $26 million on Wednesday, its lowest level since September 2024. The rising OI reflects renewed risk appetite and strengthening investor confidence, supporting SHIB’s rebound.
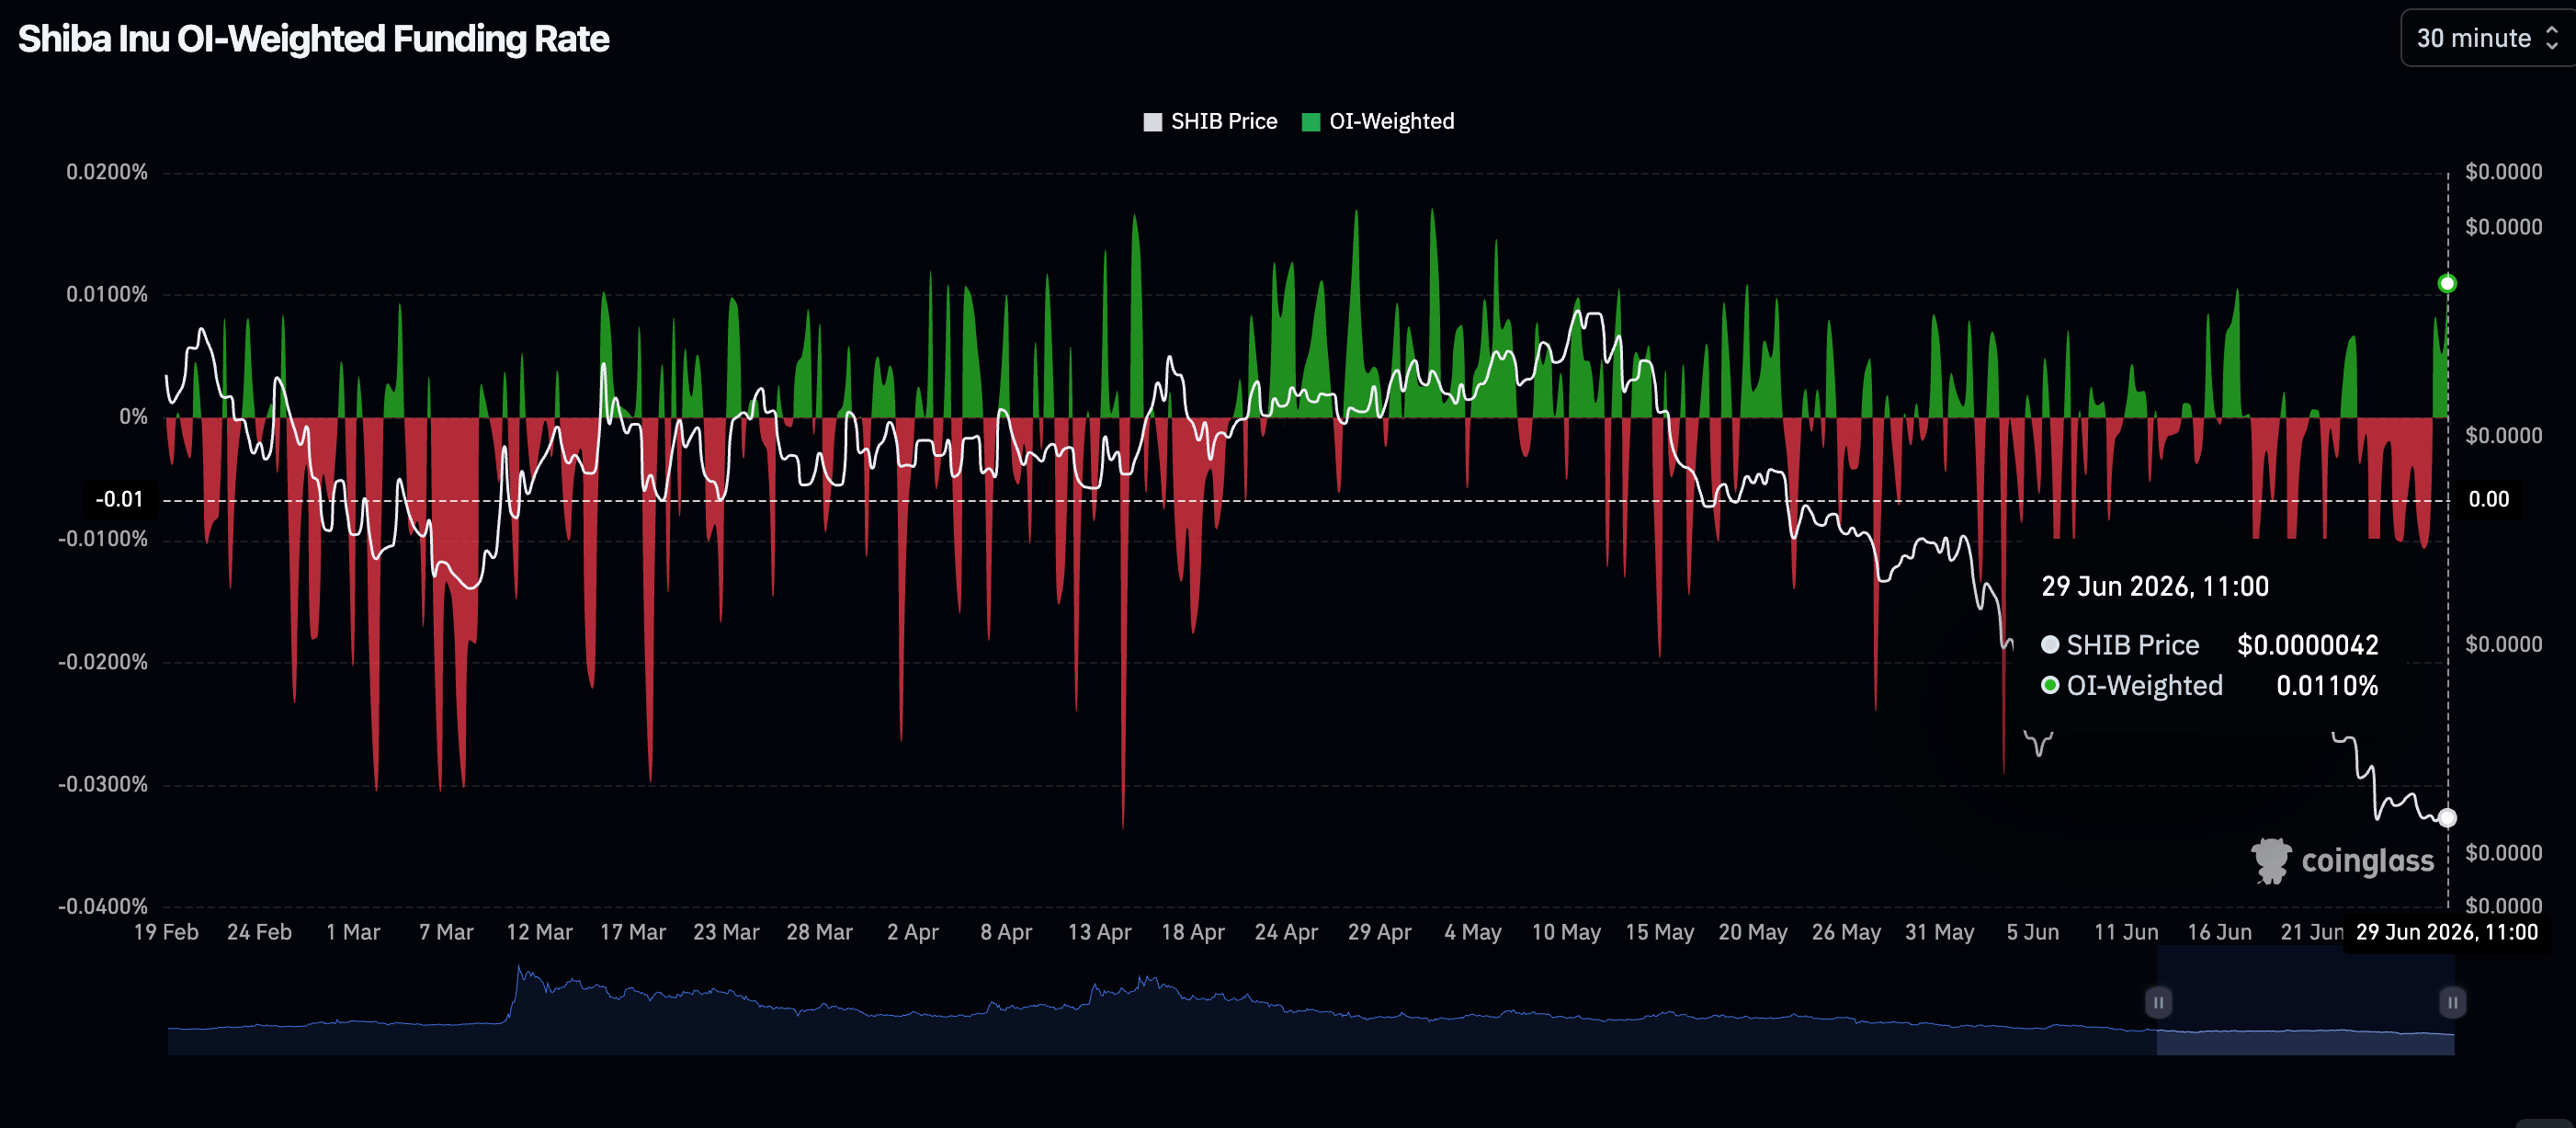
Investors are increasingly betting on higher SHIB prices, as evidenced by the OI-Weighted Funding Rate, which holds in positive territory at 0.011% on Monday, up from 0.0052% the previous day.
Price analysis: Shiba Inu rebounds but resistance caps further upside
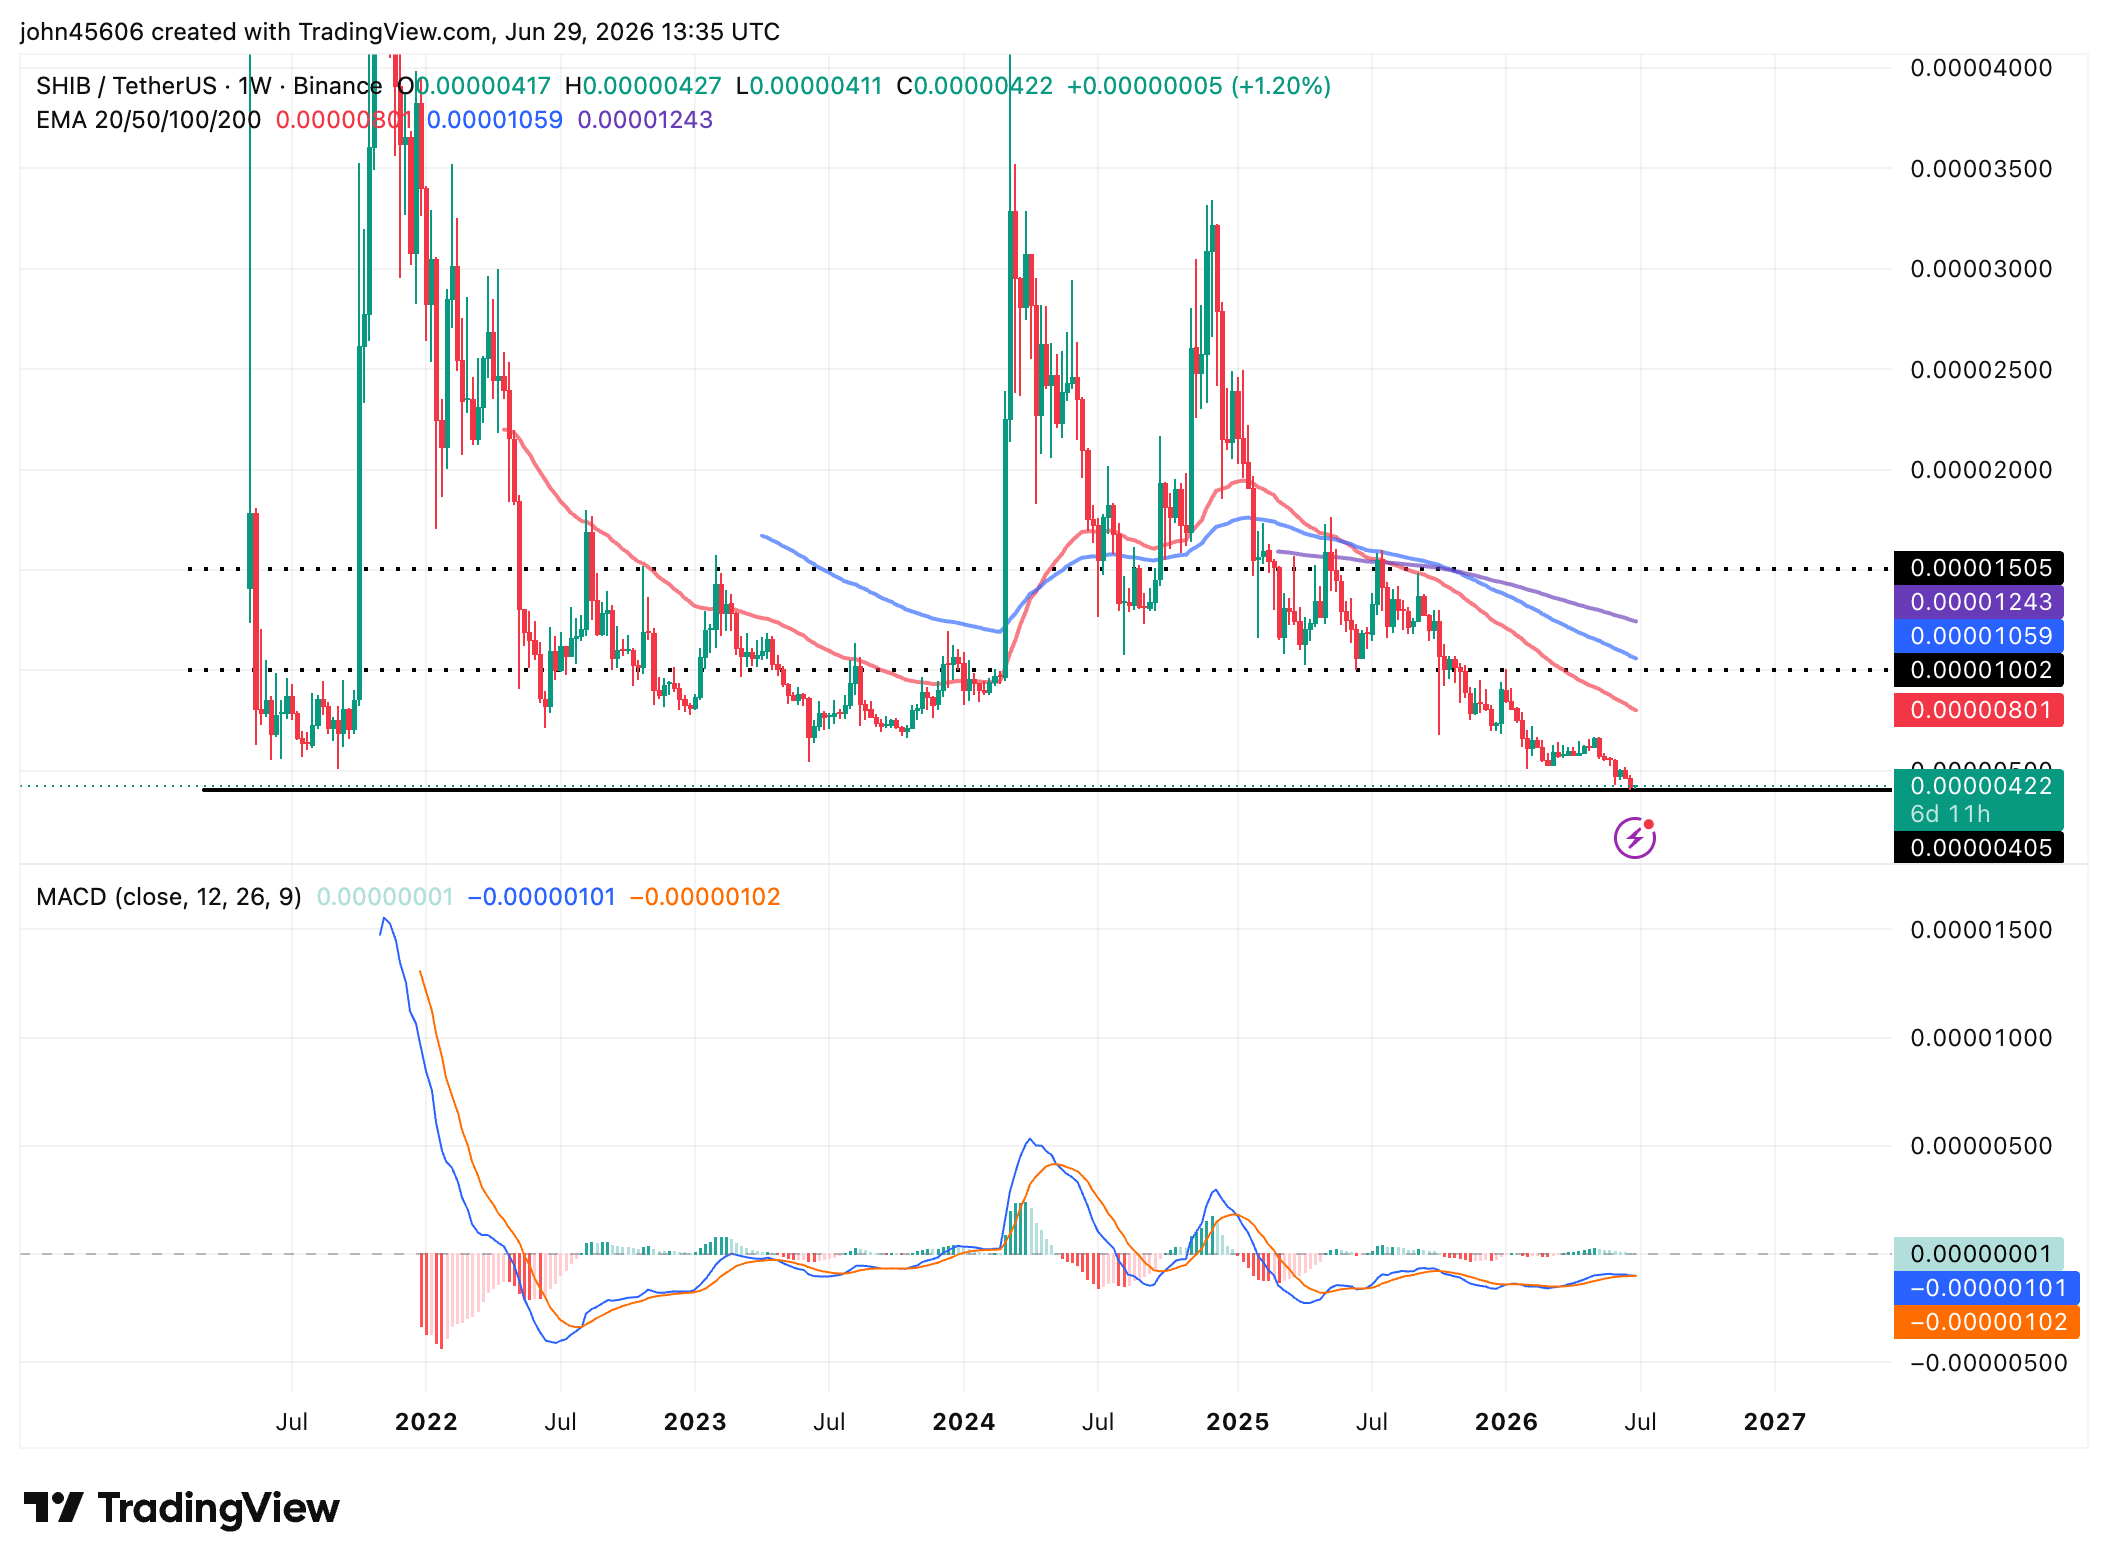
Shiba Inu trades around $0.00000419 as buyers reengage following a sharp drop to $0.00000405, the historical floor price. The Moving Average Convergence Divergence (MACD) histogram holds slightly in positive territory and is contracting, signaling the need for follow-through momentum.
Despite the ongoing rebound, SHIB holds below the next resistance level at $0.0000050. Moreover, major moving averages, including the 50-week Exponential Moving Average (EMA) at $0.0000080, the 100-week EMA at $0.0000106 and the 200-week EMA at $0.0000124, cap the upside, limiting Shiba Inu’s recovery potential.
On the daily chart, the MACD shows a stronger bearish bias, with the histogram deep in negative territory. The 50-day, 100-day, and 200-day EMAs at $0.0000050, $0.0000055, and $0.0000066, respectively, slope downwards, aligning Shiba Inu with a broader bearish trend.
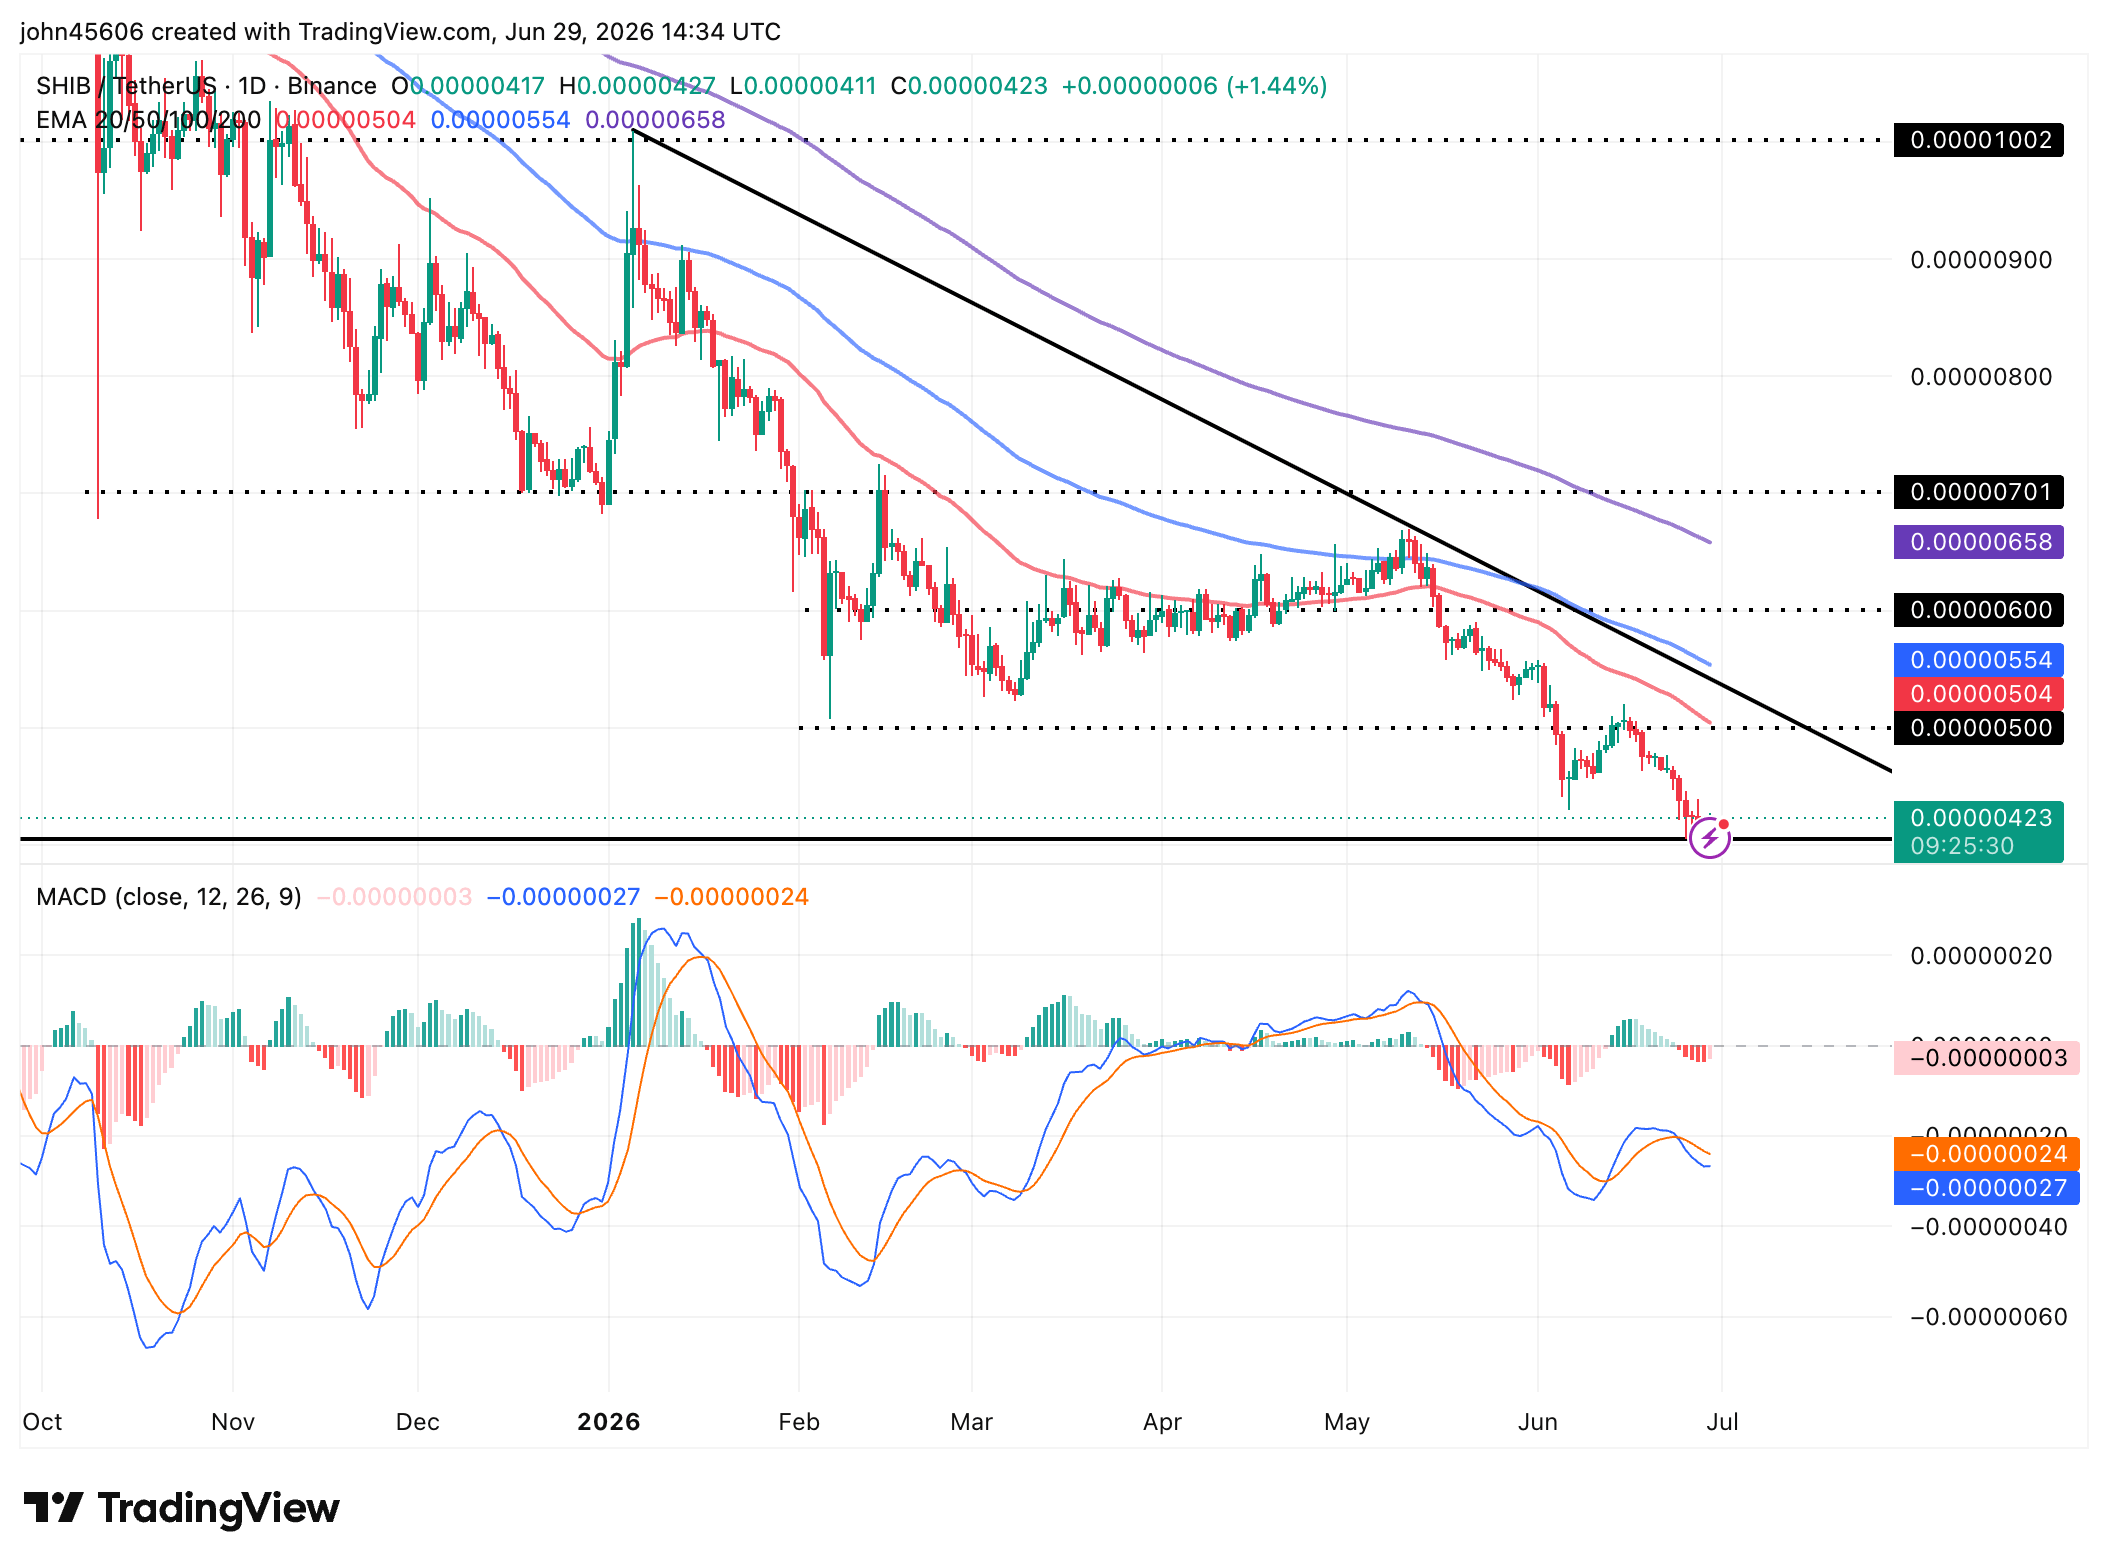
Looking down, the all-time low of $0.00000405 serves as the primary support level. If broken, it could trigger an extended sell-off toward the next psychological levels at $0.0000030 and $0.0000020. Holding above the current level at $0.0000019 would assure traders of a potential rebound, targeting $0.0000050 in the short term.
Open Interest, funding rate FAQs
Higher Open Interest is associated with higher liquidity and new capital inflow to the market. This is considered the equivalent of increase in efficiency and the ongoing trend continues. When Open Interest decreases, it is considered a sign of liquidation in the market, investors are leaving and the overall demand for an asset is on a decline, fueling a bearish sentiment among investors.
Funding fees bridge the difference between spot prices and prices of futures contracts of an asset by increasing liquidation risks faced by traders. A consistently high and positive funding rate implies there is a bullish sentiment among market participants and there is an expectation of a price hike. A consistently negative funding rate for an asset implies a bearish sentiment, indicating that traders expect the cryptocurrency’s price to fall and a bearish trend reversal is likely to occur.
Recommended Articles







Comments (0)
Click the $ button, enter the symbol, and select to link a stock, ETF, or other ticker.