


Pi Network Price Forecast: PI could see further weakness ahead of Pi2Day



- Pi Network defends $0.1250 on Thursday, following two consecutive days of losses.
- The PI token remains susceptible to further weakness ahead of Pi2Day on Sunday.
- The technical outlook for PI is bearish, with selling pressure resurfacing after a minor recovery.
Pi Network (PI) price remains under downside pressure amid declining social interest, likely influenced by the broader market risk-off sentiment. The upcoming Pi2Day on Sunday marks the first-year anniversary of Pi App Studio, Ecosystem Directory Staking, and other network updates. Technically, the PI token remains at risk of a steeper correction as bearish momentum resurfaces.
Social interest remains low ahead of Pi2Day
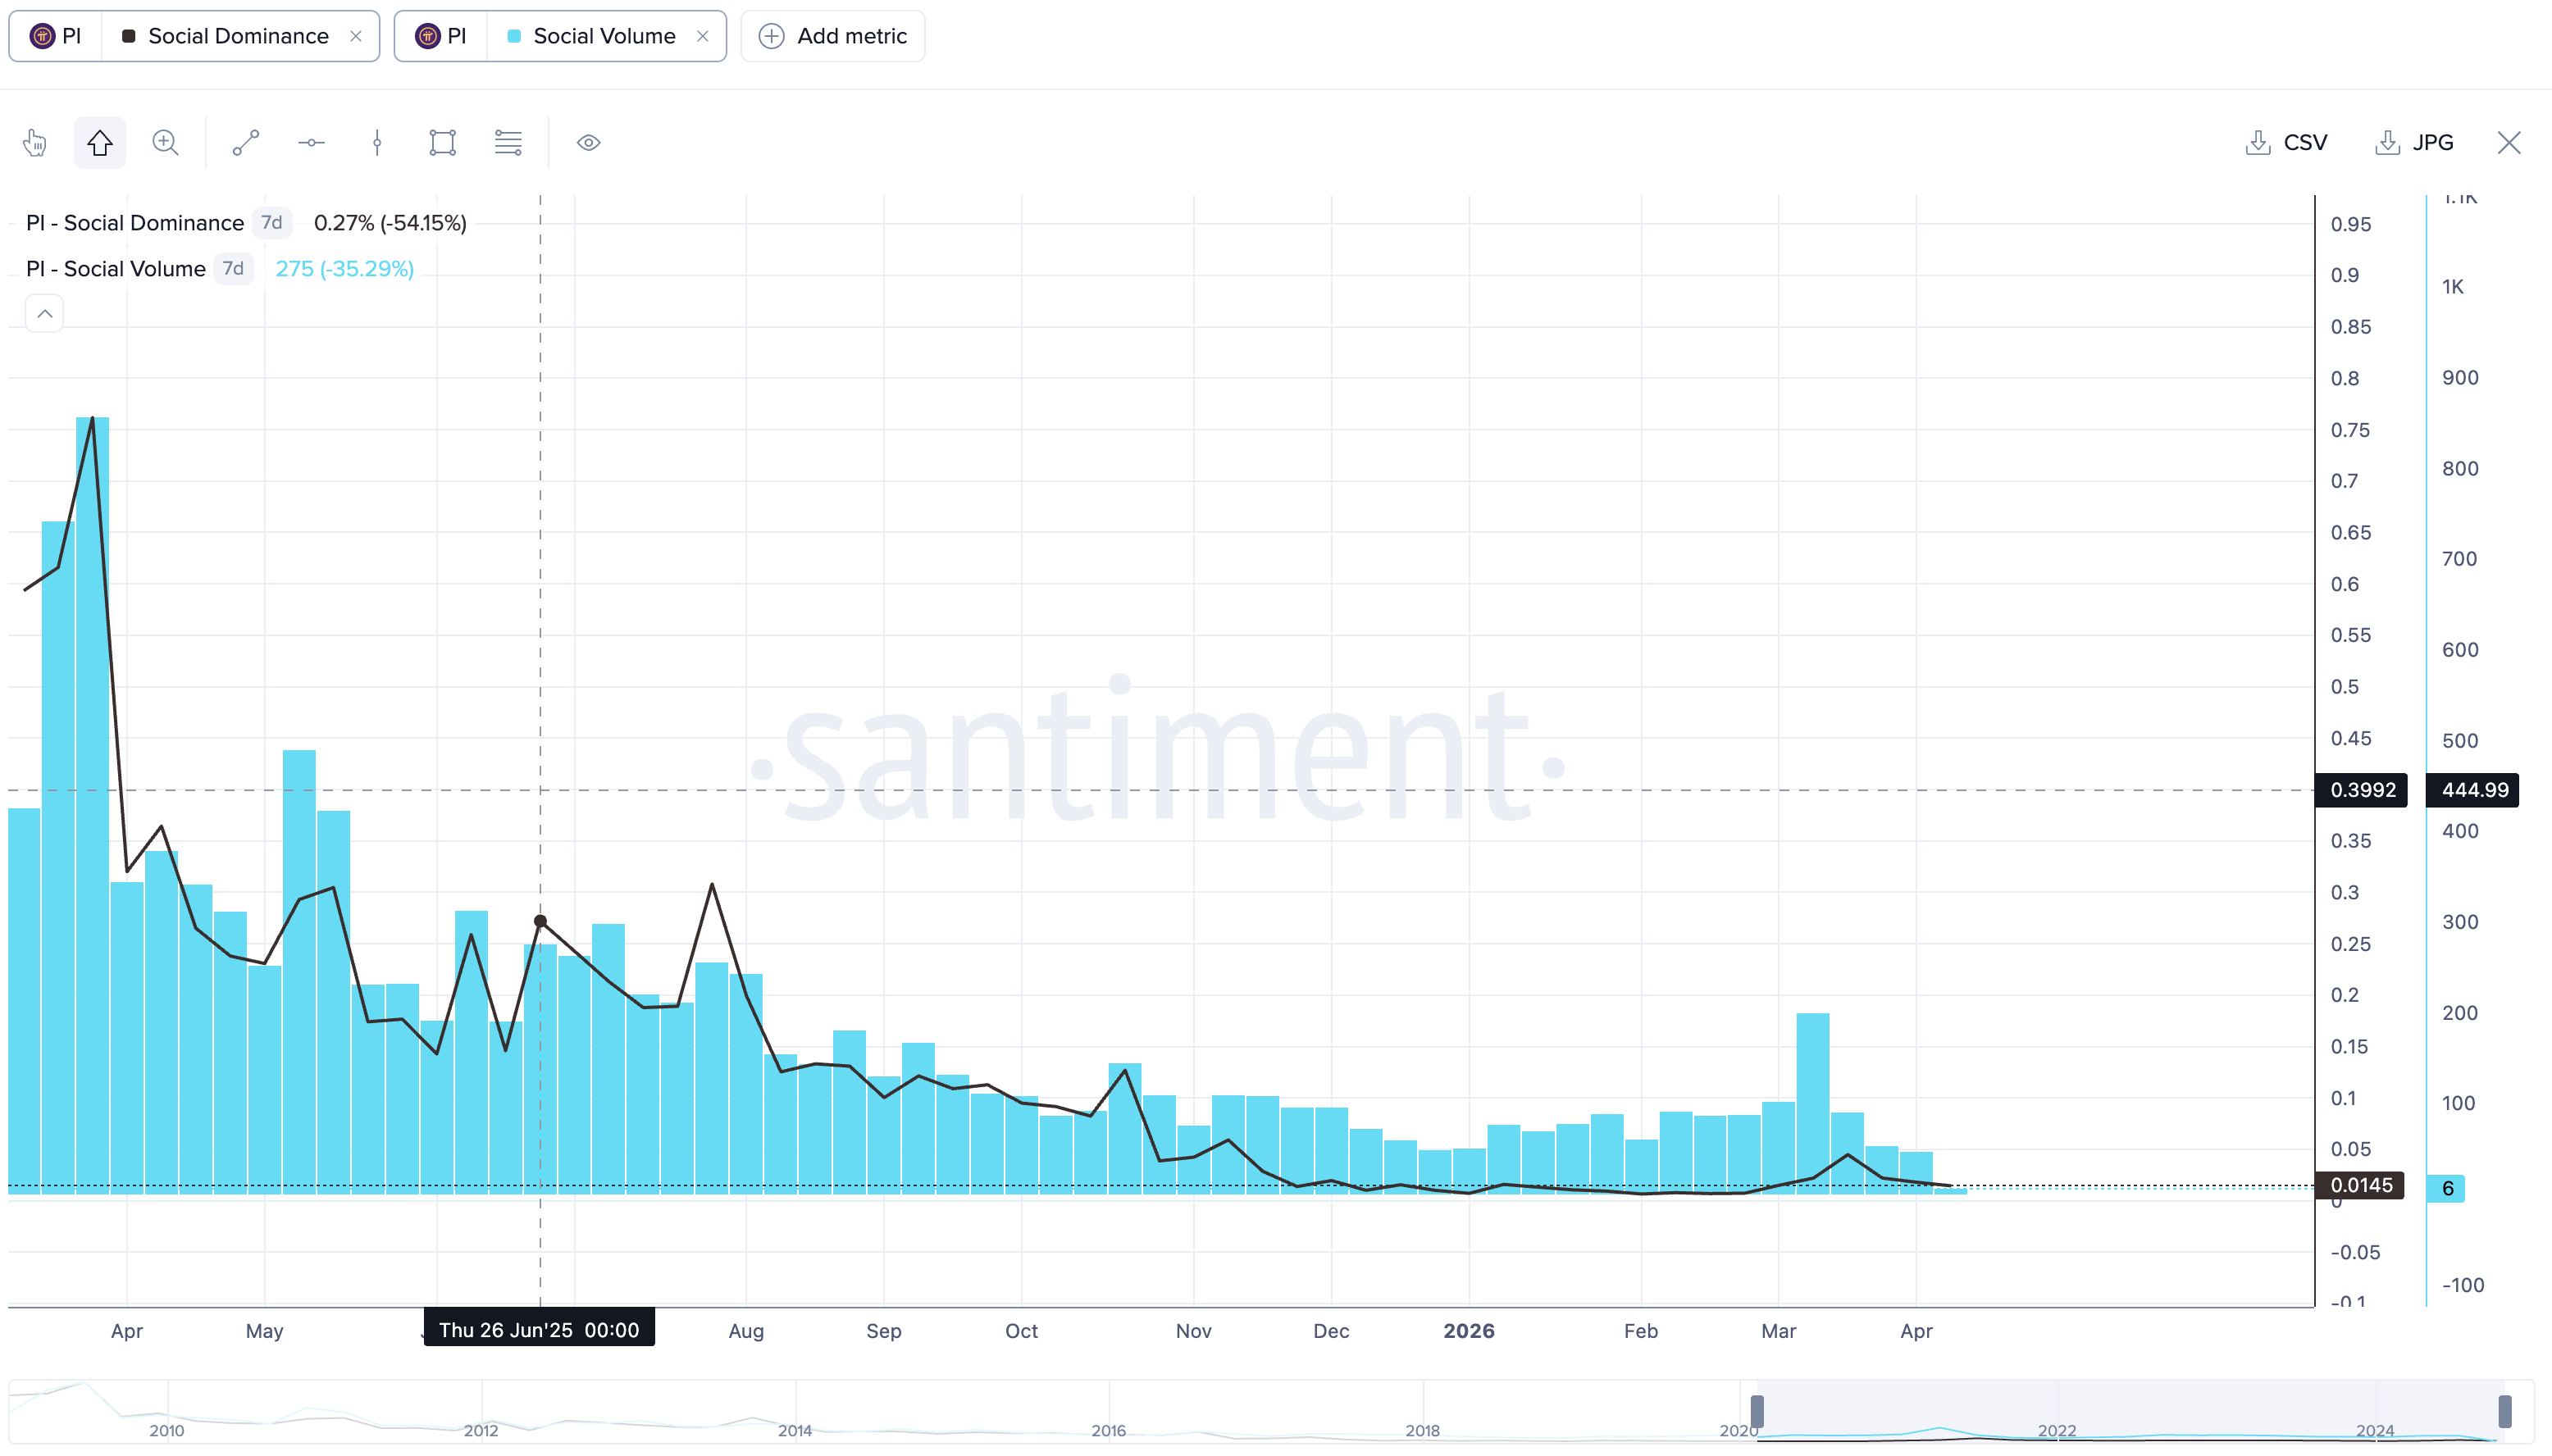
Pi Network maintains a broader downward trend amid declining social buzz ahead of its Pi2Day on Sunday. Santiment data shows the Social Dominance of PI is down to 0.0145% this week, down from 0.27% last year’s Pi2Day. At the same time, the social volume has fallen to 6 this week from 275, reaffirming the reduced interest in PI among crypto investors. The correlation between falling PI token prices and its social buzz confirms the network’s community-driven, speculative nature. Notably, the upcoming Pi2Day marks the first-year anniversary of Pi App Studio, Ecosystem Directory Staking, Node updates, and the Node ranking page.
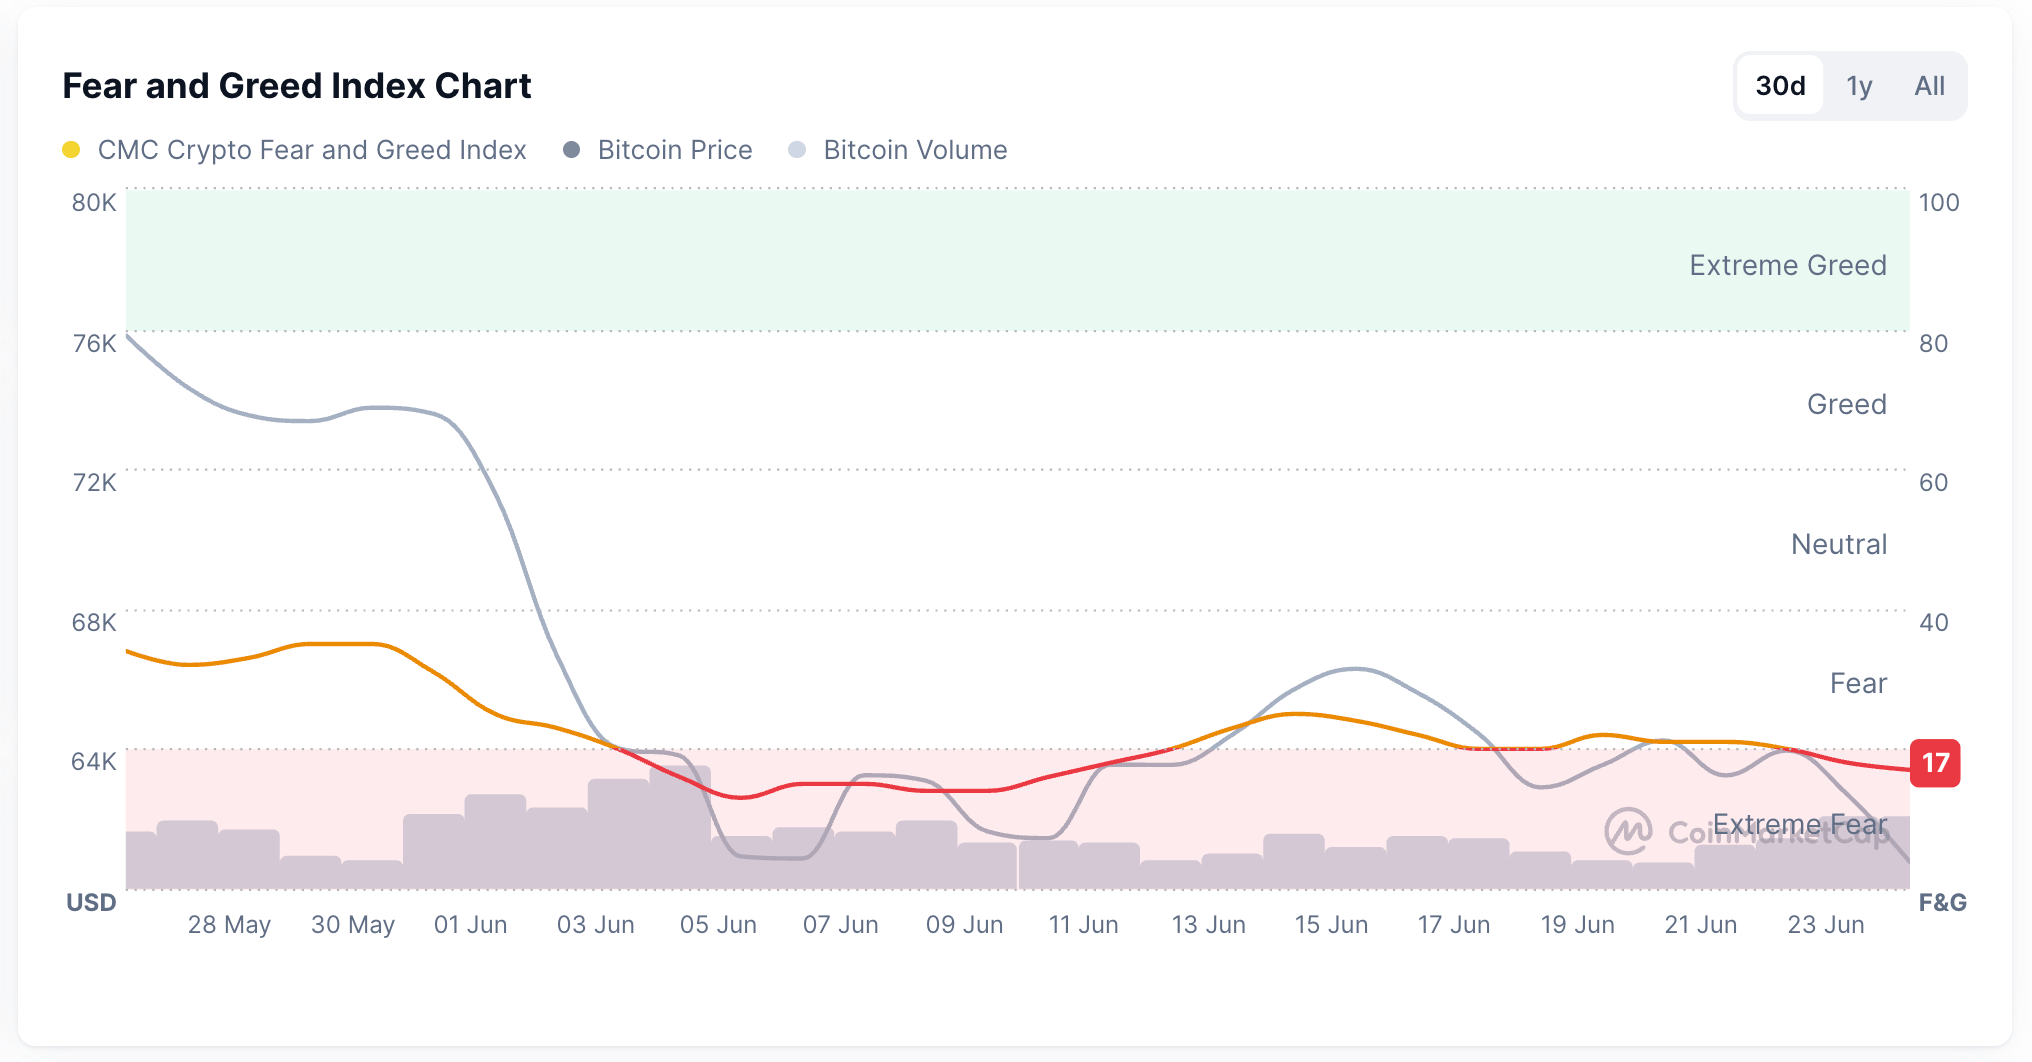
Meanwhile, the broader crypto market sentiment remains under immense pressure. CoinMarketCap’s Fear and Greed Index at 17 deepens into the Extreme Fear zone, pointing to firm risk-off sentiment among investors.
Is Pi Network on track for another leg lower?
Pi Network trades below $0.1300 at press time on Thursday, maintaining a broadly bearish bias. The 50-day and 200-day Exponential Moving Averages (EMAs) cap the upside at $0.1433 and $0.1904, respectively, reinforcing the broader downtrend.
From a technical perspective, the pullback in PI risks falling back under the broken descending resistance trendline, near $0.1238, which offers only marginal support for a base. That said, momentum is mixed on the daily chart, with the Moving Average Convergence Divergence (MACD) risking a cross below its signal line, while the Relative Strength Index (RSI) remains below the midline at 36, reflecting weak demand after an oversold bounce.
On the downside, immediate support is seen around the former descending trendline break at $0.1238, where buyers may attempt to defend the recent recovery, followed by the June 6 low at $0.1184.
On the topside, initial resistance emerges at the 50-day EMA near $0.1433, with a sustained break needed to ease the prevailing bearish pressure.
(The technical analysis of this story was written with the help of an AI tool.)
Recommended Articles








Comments (0)
Click the $ button, enter the symbol, and select to link a stock, ETF, or other ticker.