


Pi Network Price Forecast: PI extends decline amid network upgrade



- Pi Network edges lower on Wednesday, extending losses for the fourth consecutive day.
- The Pi Core Team pushes the mainnet upgrade to protocol 24, with all mainnet node operators required to complete it by June 2.
- The technical outlook for PI is bearish, with selling pressure mounting.
Pi Network (PI) is under intense selling pressure, retracing below $0.1500 at press time on Wednesday. Pi Core Team announces June 2 as the deadline for the mainnet upgrade to the next Stellar protocol version 24. Technical outlook for PI remains bearish as selling pressure builds.
Pi Network’s next mainnet upgrade
Pi Network’s core team continues to steadily push mainnet upgrades, with the Stellar protocol version 24 next in line. The underlying custom protocol of the Pi ecosystem is adapted from the Stellar blockchain, which requires it to pull the latest upgrades for added functionality.

The team announced a June 2 deadline for all mainnet nodes to complete the necessary upgrades to avoid downtime. Retail interest in mainnet upgrades is declining even as the downward price spiral continues.
How low will the PI token go?
Pi Network inches closer to $0.1400 at press time on Wednesday, extending its bearish bias as price remains well below the 50-, 100-, and 200-period Exponential Moving Averages (EMAs) at $0.1507, $0.1564, and $0.1634.
The cluster of overhead EMAs reinforces the prevailing downtrend, while the Relative Strength Index (RSI) near 28 slips into oversold territory on the 4-hour chart and the Moving Average Convergence Divergence (MACD) descends below its signal line on the same chart, suggesting that bearish momentum persists even as short-term selling pressure appears stretched.
Looking down, the S2 Pivot Point serves as the immediate line of defense at $0.1410, guarding the downside to the S3 Pivot Point at $0.1357.
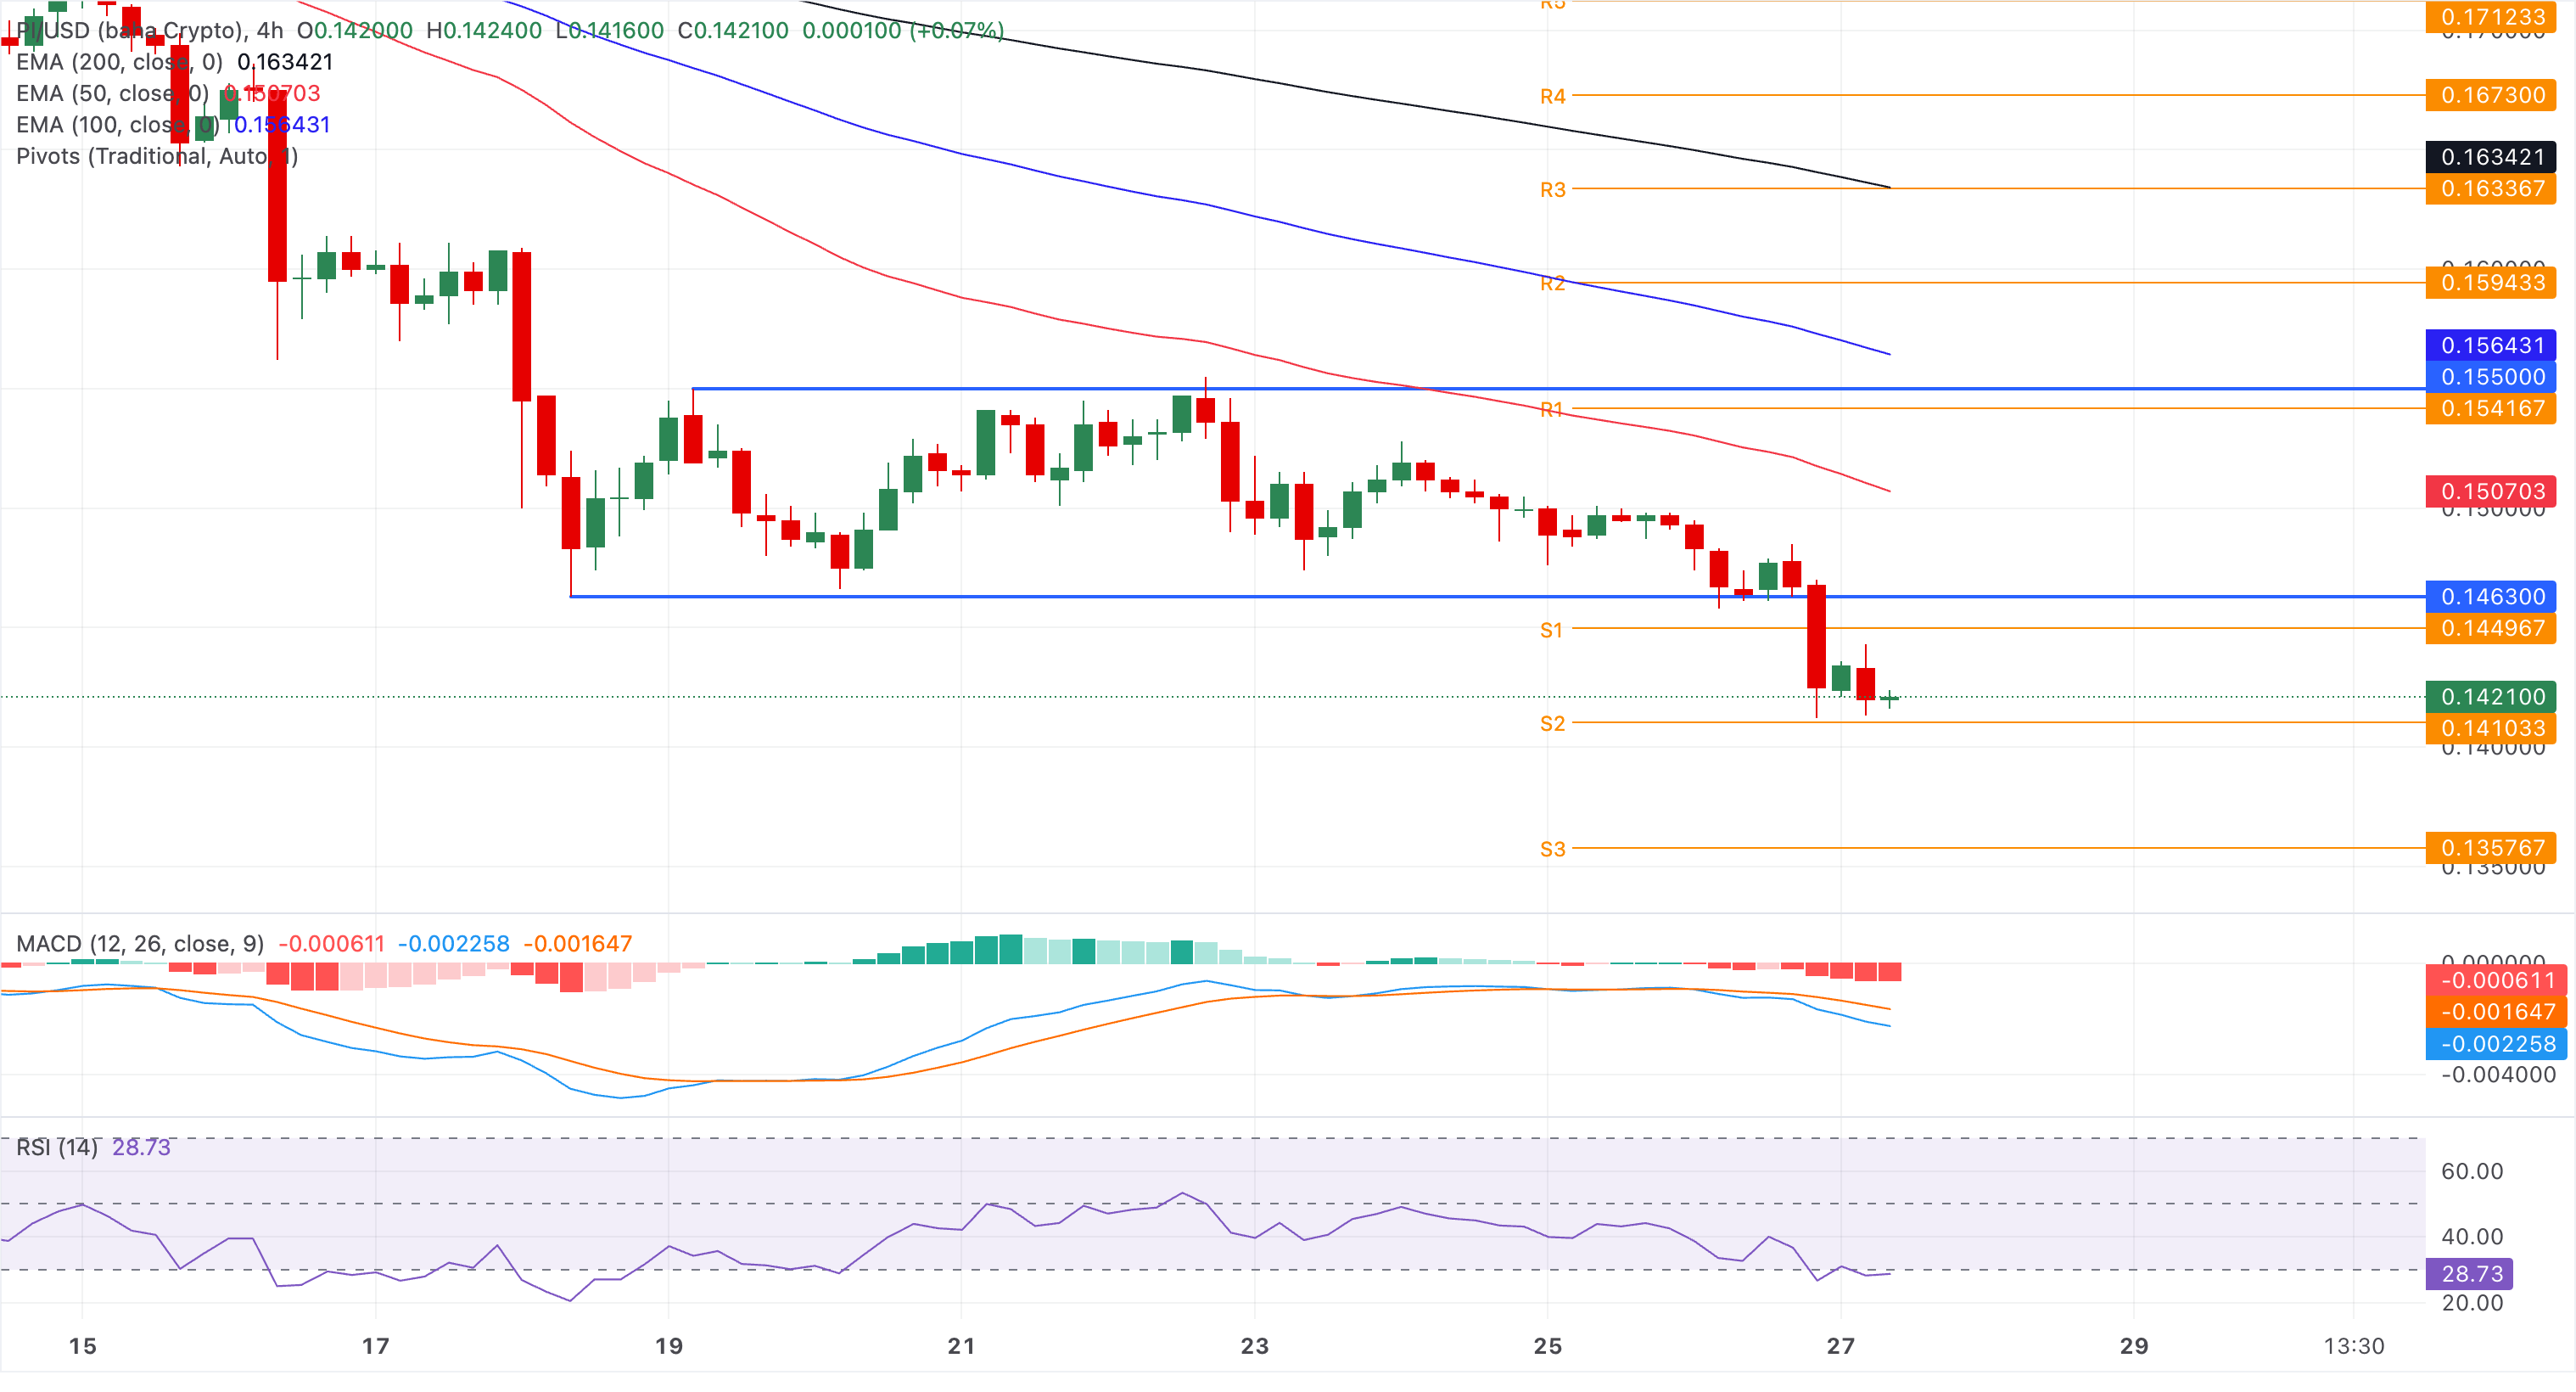
On the topside, initial resistance is seen at the lost S1 Pivot Point at $0.1449, close to the broken support level of $0.1463. A move above that zone would then face the 50-period EMA at $0.1507.
(The technical analysis of this story was written with the help of an AI tool.)
Recommended Articles









Comments (0)
Click the $ button, enter the symbol, and select to link a stock, ETF, or other ticker.