


CRWV Stock Price Forecast: Upgraded to Buy by Goldman Sachs but Price Target Cut by 23%, Technicals Show Stock May Still Fall



AI Podcast


On October 19 ET, Goldman Sachs upgraded CoreWeave from Neutral to Buy while lowering its price target from $139 to $106, citing overdone financing fears and improving computing power investment returns. Although the rating lifted the stock by nearly 3%, technical indicators show a dominant downtrend, with prices remaining below all exponential moving averages and forming a bearish alignment. Sustained recovery hinges on whether revenue growth from new contracts can offset higher capital costs. Downside risks involve breaking previous lows or failing to surpass near-term moving average resistance, keeping the broader bearish structure intact.

TradingKey - On October 19 ET, after Goldman Sachs upgraded CoreWeave (CRWV) from "Neutral" to "Buy," its stock price bounced back by nearly 3%. At the same time, however, the bank lowered its price target from $139 to $106. Its core rationale is that the market may have overestimated financing pressures while underestimating the potential for improvement in returns on computing power investments.
Goldman Sachs pointed out that while CoreWeave's unsecured bond yields have risen to 13.5%–15%, the company primarily relies on asset-backed loans for expansion, meaning bond yields cannot be used directly to measure all new financing costs. The bank estimates that composite debt costs could rise by 1 to 2 percentage points from current levels.
If actual financing conditions turn out to be better than feared by the market, the erosion of profits by interest expenses could be less than expected. This would also help alleviate investor concerns over the sustainability of its expansion, creating conditions for valuation recovery.
Goldman Sachs set its initial assumption for annualized recurring revenue per megawatt for new long-term contracts at $13 million, higher than the current blended level of around $10 million. In an illustrative model that excludes GPU residual value after five years, $13 million corresponds to an unlevered after-tax internal rate of return (IRR) of 15.3%, above the model's weighted average cost of capital (WACC) of 11.8%. This implies that Goldman Sachs' bullish stance relies on new contracts boosting revenue per unit of computing power.
Goldman Sachs also lowered its forward EBIT valuation multiple from 22x to 18x, indicating that while the bank recognizes the opportunity following the pullback, it still requires a valuation discount for risks such as debt.
Therefore, while this rating upgrade may help restore confidence, a sustained stock price recovery still hinges on contract returns and financing conditions. If improvements in computing power revenue can cover higher capital costs, earnings expectations could be supported; however, if future supply increases weigh down renewal prices, long-term leases and debt burdens will continue to constrain valuation.
From a technical perspective, despite CoreWeave's roughly 3% gain following the Goldman Sachs upgrade, the current price remains below all exponential moving averages (EMAs). The current movement represents a weak technical bounce near previous lows following a sharp sell-off, and a bottom reversal has not yet formed.
Structurally, after peaking in May, subsequent bounce highs progressively lowered; the August bounce failed to reverse the corrective trend, and from September to early October, the stock consolidated repeatedly at lower levels before accelerating downward. This pullback has now approached previous lows, indicating that the earlier consolidation failed to build a valid bottom, with the downtrend remaining dominant.
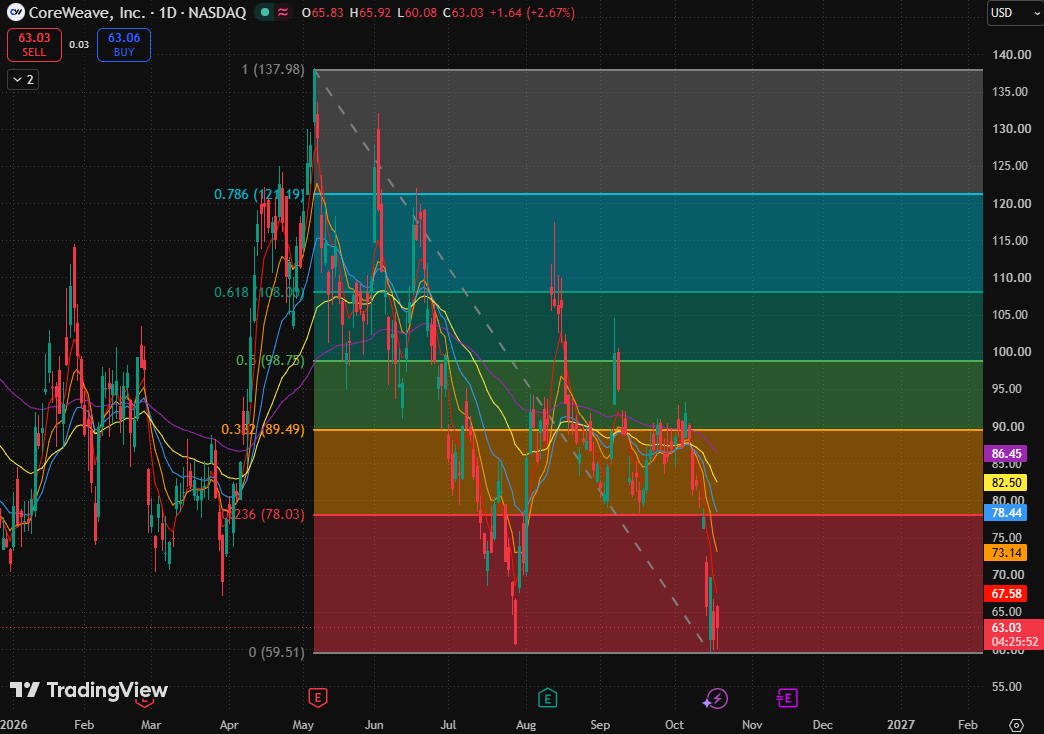
CoreWeave stock price chart, Source: TradingView
Regarding moving averages, the 5-day, 10-day, 20-day, 80-day, and 160-day exponential moving averages stand at $67.67, $73.18, $78.46, $82.52, and $86.46, respectively, forming a complete bearish alignment with short-term moving averages fanning downward. With the current price yet to reclaim the shortest-term moving average, intraday recoveries from low points merely suggest buying support on dips, which is insufficient to prove that selling pressure has been fully digested.
The primary risk currently is that support at previous lows fails, turning the current 'weak low-level bounce' into a downward breakdown. A secondary risk is that the bounce remains capped by the shortest-term moving average, leading to another retest of the lows. Only by reclaiming short-term moving averages and forming higher lows on pullbacks would there be a basis for a meaningful easing of the current bearish outlook.
Overall, the bounce can only continue if the stock holds above recent lows and firmly reclaims the 5-day exponential moving average; a decisive break below previous lows would invalidate the current buying support thesis, further extending the downward structure.
In terms of upside resistance, the first hurdle is the 5-day exponential moving average, followed by the 10-day exponential moving average at $73.18; stronger resistance lies between $78.03 and $78.46, where a lost Fibonacci level converges with the 20-day exponential moving average.
This content was translated using AI and reviewed for clarity. It is for informational purposes only.
Recommended Articles










Comments (0)
Click the $ button, enter the symbol, and select to link a stock, ETF, or other ticker.