

Crypto Today: Bitcoin, Ethereum, XRP face recovery headwinds amid declining risk appetite

- Bitcoin attempts to reclaim the $80,000 level amid deteriorating technical indicators and waning institutional interest.
- Ethereum trades below the 50-day EMA, weighed down by growing ETF outflows and declining momentum indicators.
- XRP holds lifeline support at $1.40 despite overhead pressure from medium and long-term moving averages.
Bitcoin (BTC) edges higher, from the daily low at $78,922, aiming for a breakout above the pivotal $80,000 level on Thursday. Altcoins, including Ethereum (ETH) and Ripple (XRP), are showing signs of a gradual rebound after headwinds trimmed early-week gains cooled.
ETH hovers around $2,270, while XRP trades at $1.43 at the time of writing, attempting a reversal amid technical and risk-off sentiment headwinds.
Crypto market sentiment dwindles amid capital flight
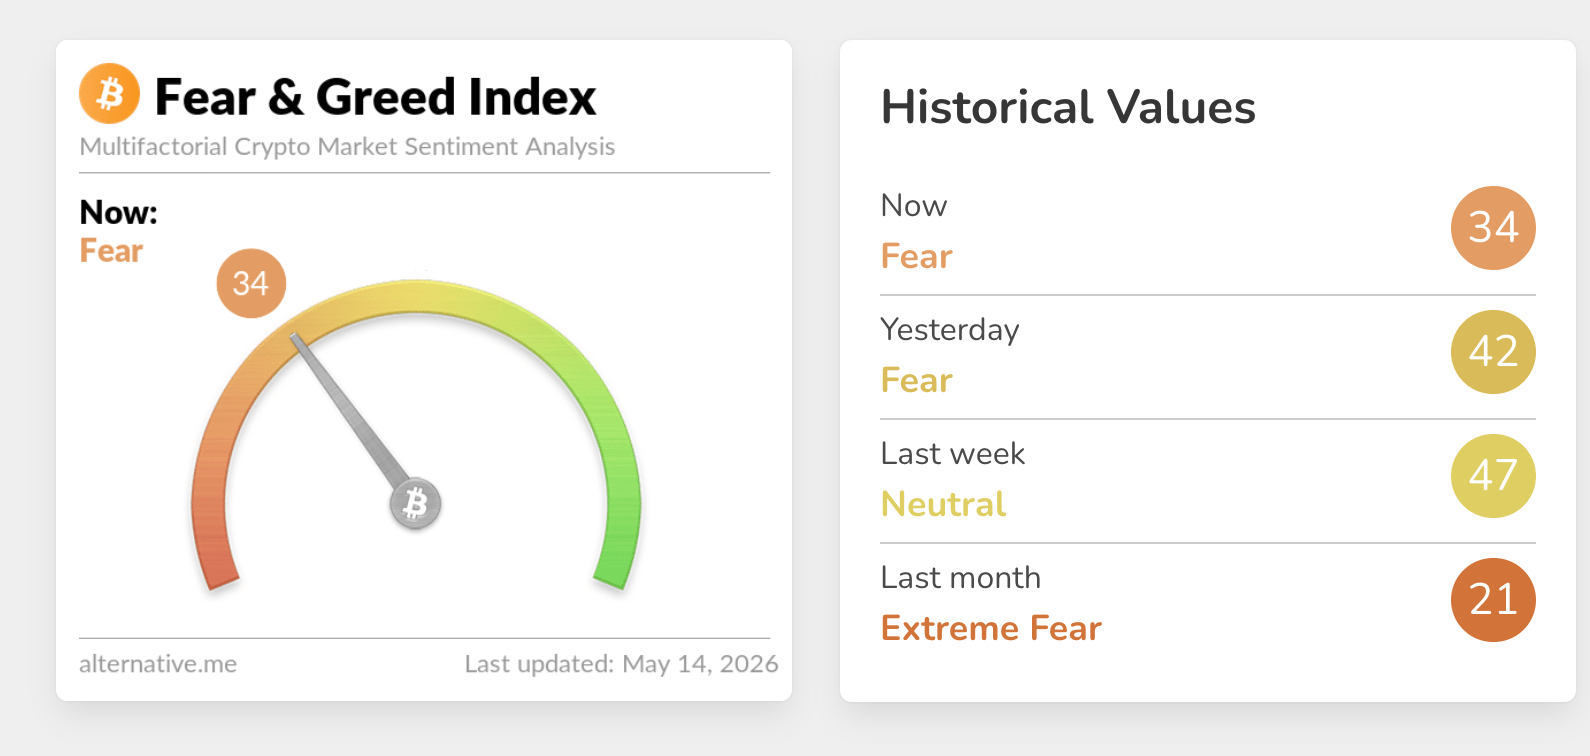
Sentiment in the broader market extended its weakness on Thursday, as reflected by the crypto Fear & Greed Index falling to 34 in the fear territory, from 42 the previous day and 47 last week.
The persistent decline suggests investor exhaustion after Bitcoin, Ethereum, and XRP failed to clear key resistance levels amid the rally in the first week of May.
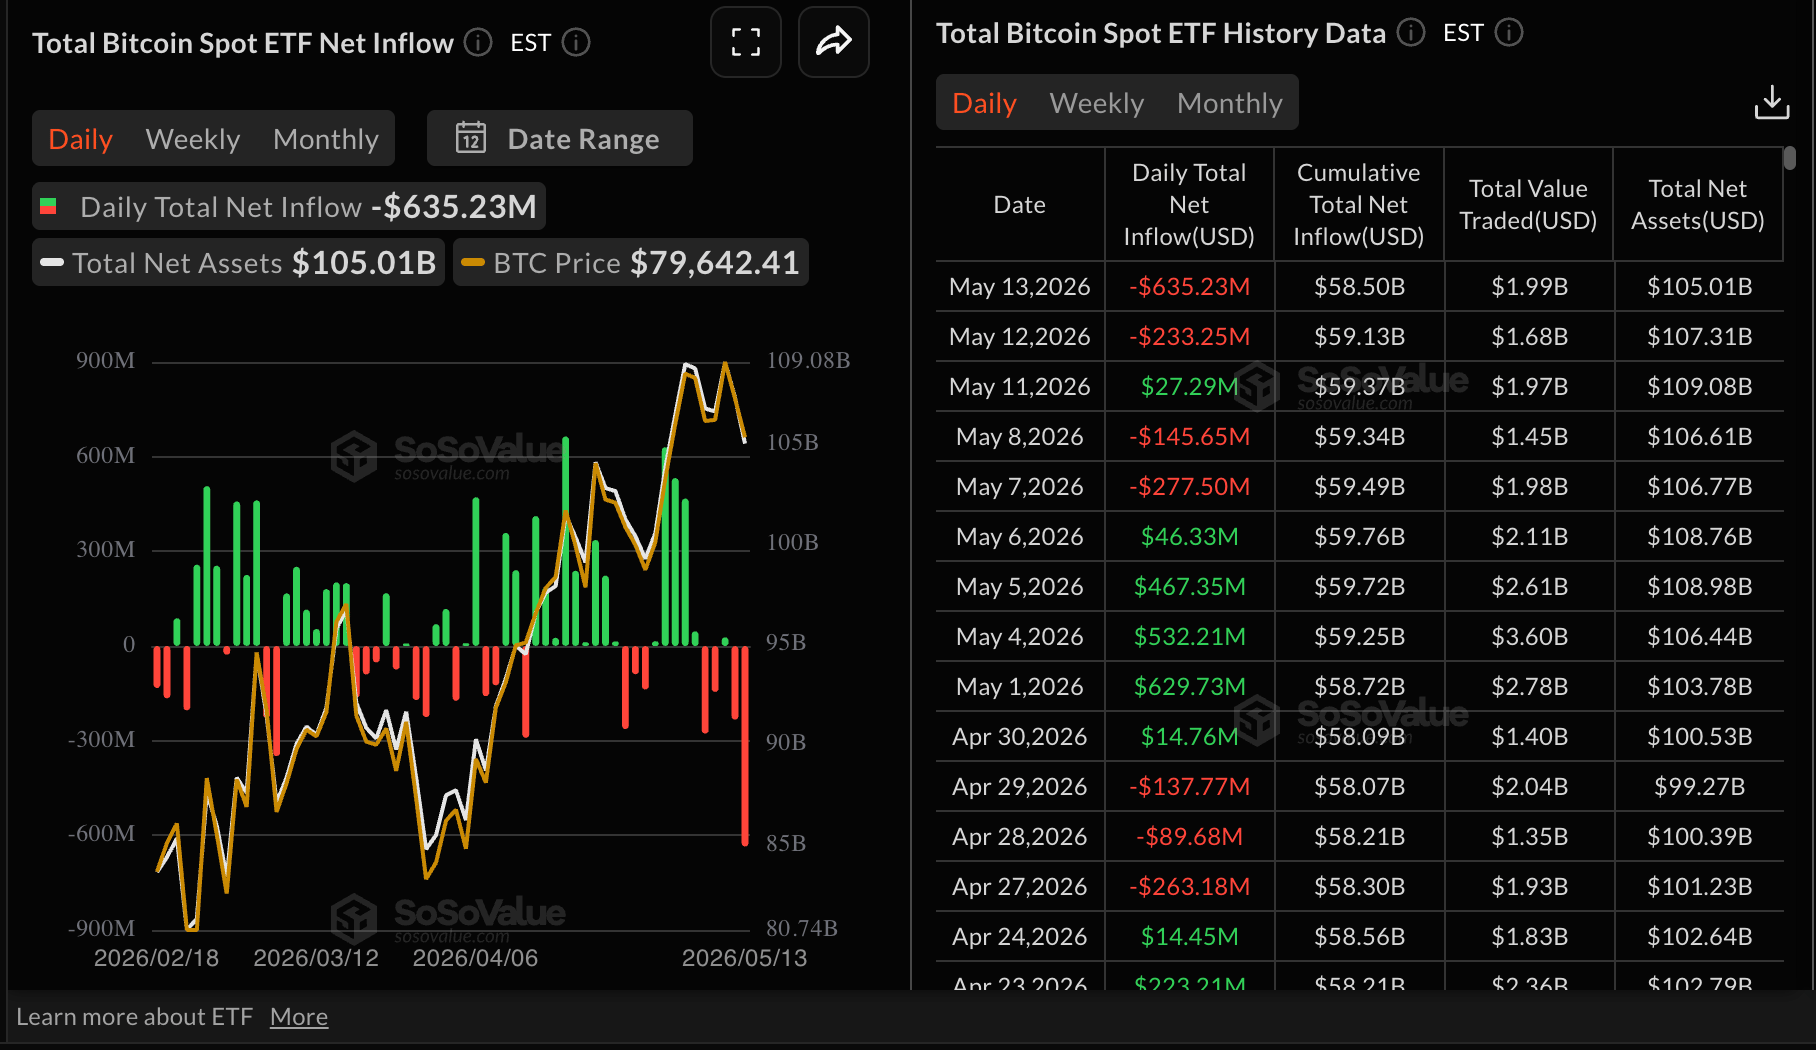
An outflow of $635 million from Bitcoin Exchange-Traded Funds (ETFs) on Wednesday, the largest since late January, underscores the pronounced risk-off tone in the market. While cumulative inflows moderated to $58.50 billion from $59.13 billion the previous day, assets under management dropped to $105.01 billion, down from $107.31 billion, highlighting persistent investor caution.
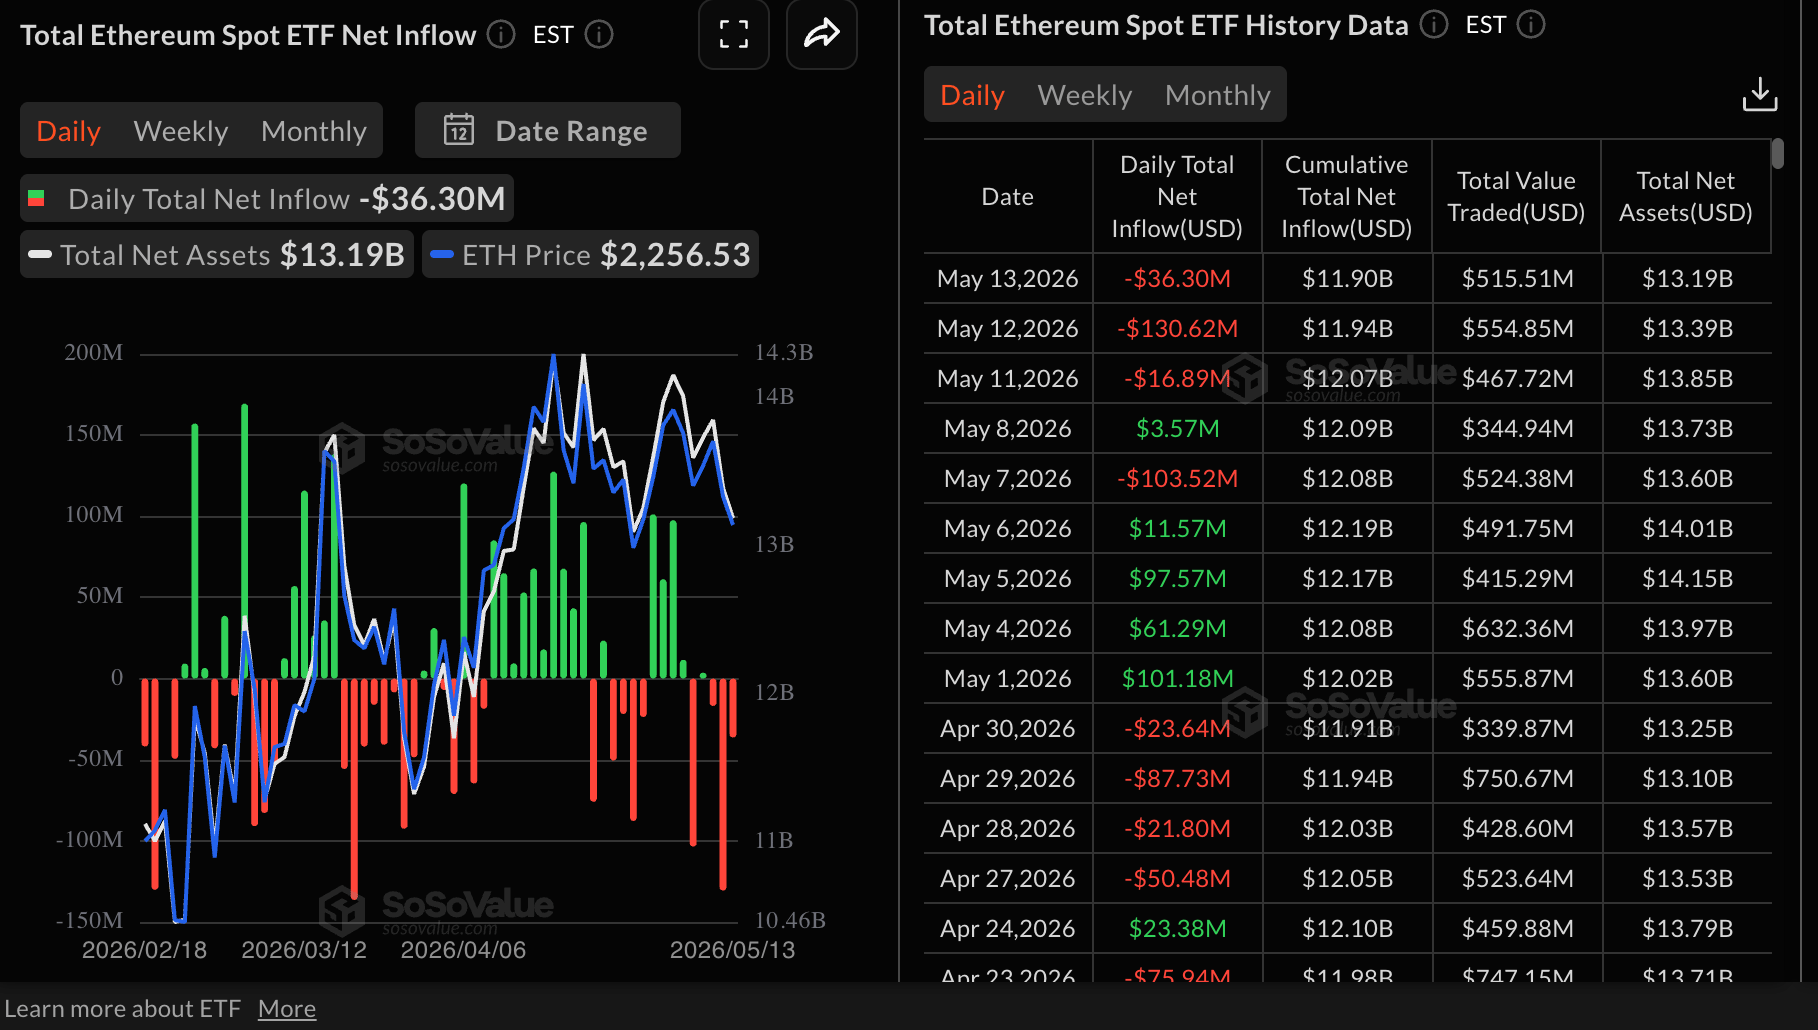
Institutional investors also fell out of sync with ETH spot ETFs, which recorded outflows of roughly $36 million on Wednesday. Although this was down from the $131 million drawn out on Tuesday, it emphasizes the headwinds in the crypto market. Still, cumulative inflows remained relatively steady at $11.90 billion, while net assets under management averaged $13.19 billion.
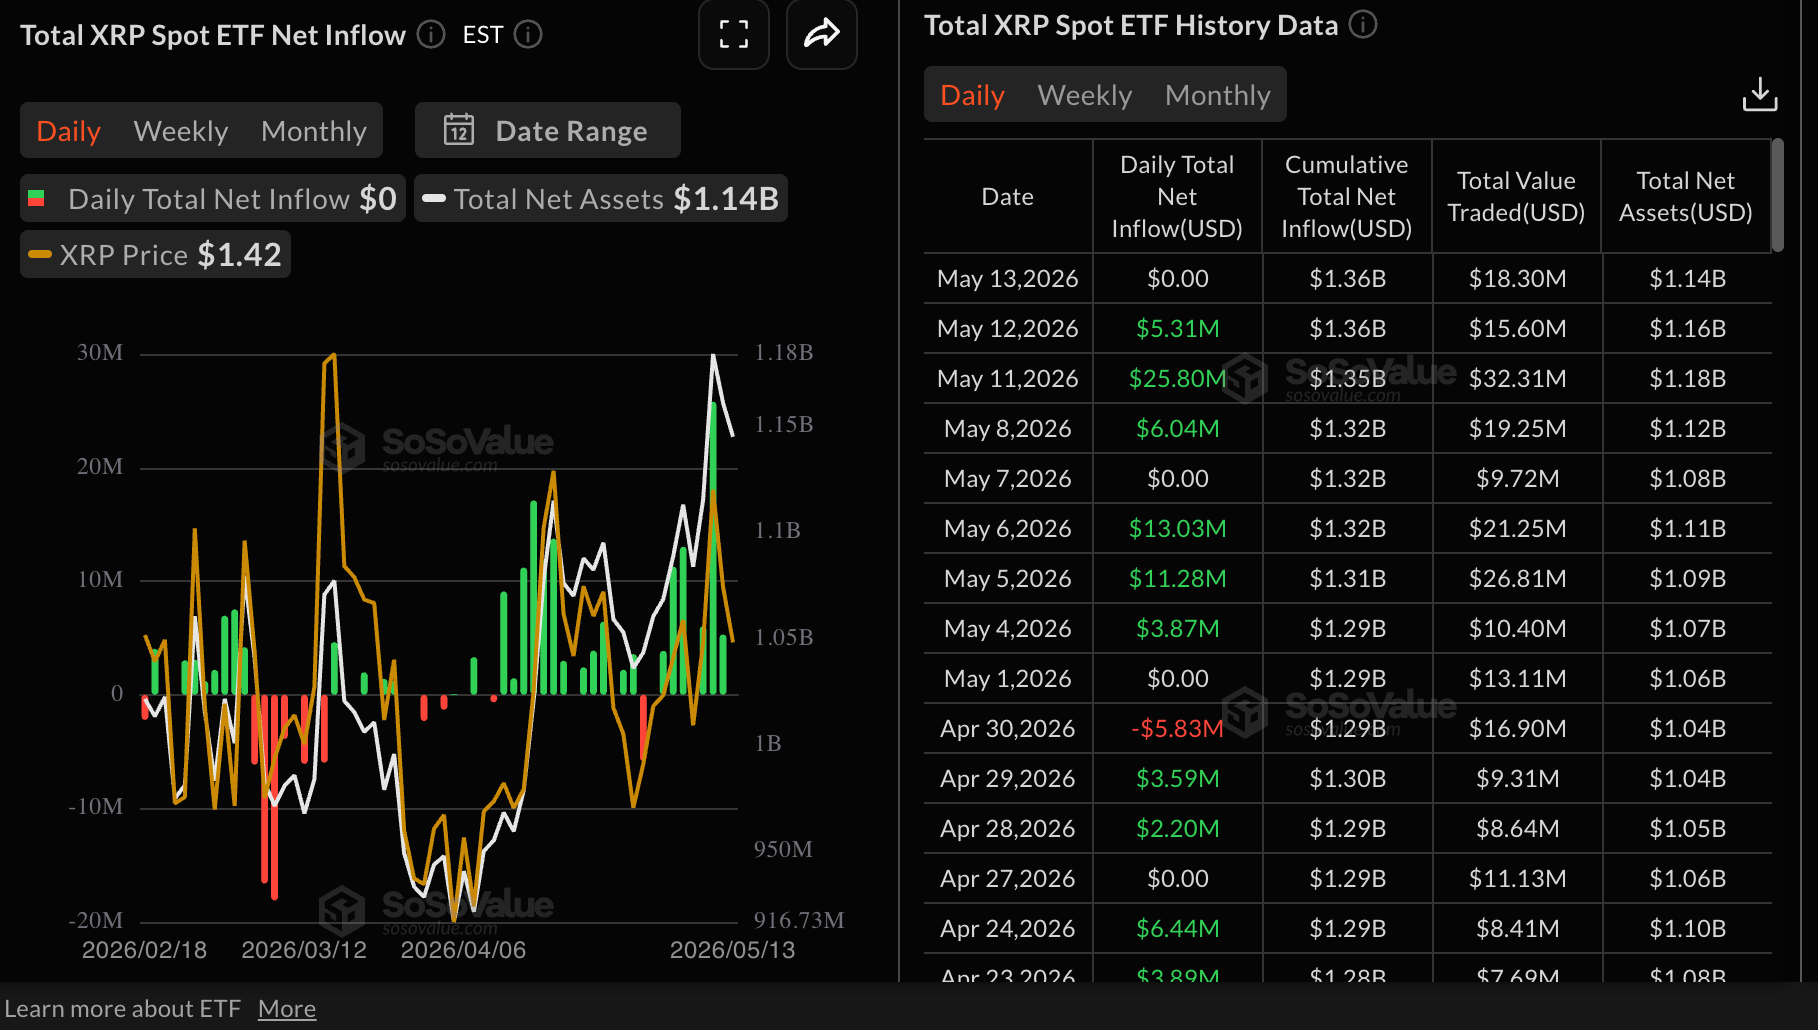
XRP spot ETFs ended a three-day streak of inflows, with Wednesday seeing no new activity, a sign of subdued investor participation. Cumulative inflows remain at $1.36 billion, while average assets under management slipped to $1.14 billion.
Technical analysis: Bitcoin steadies above key support
Bitcoin trades at $79,650, maintaining a constructive near-term bias as it holds above the 50-day and 100-day Exponential Moving Averages (EMAs) at $76,478 and $76,753, respectively. The pair is advancing away from this moving average cluster, while the 200-day EMA at $81,932 and the latest Parabolic SAR print near $82,768 sit overhead as the next caps.
Meanwhile, momentum is mixed, with the Relative Strength Index (RSI) hovering around 55 on the daily chart and the Moving Average Convergence Divergence (MACD) histogram below the zero line, suggesting upside attempts may remain gradual rather than explosive.
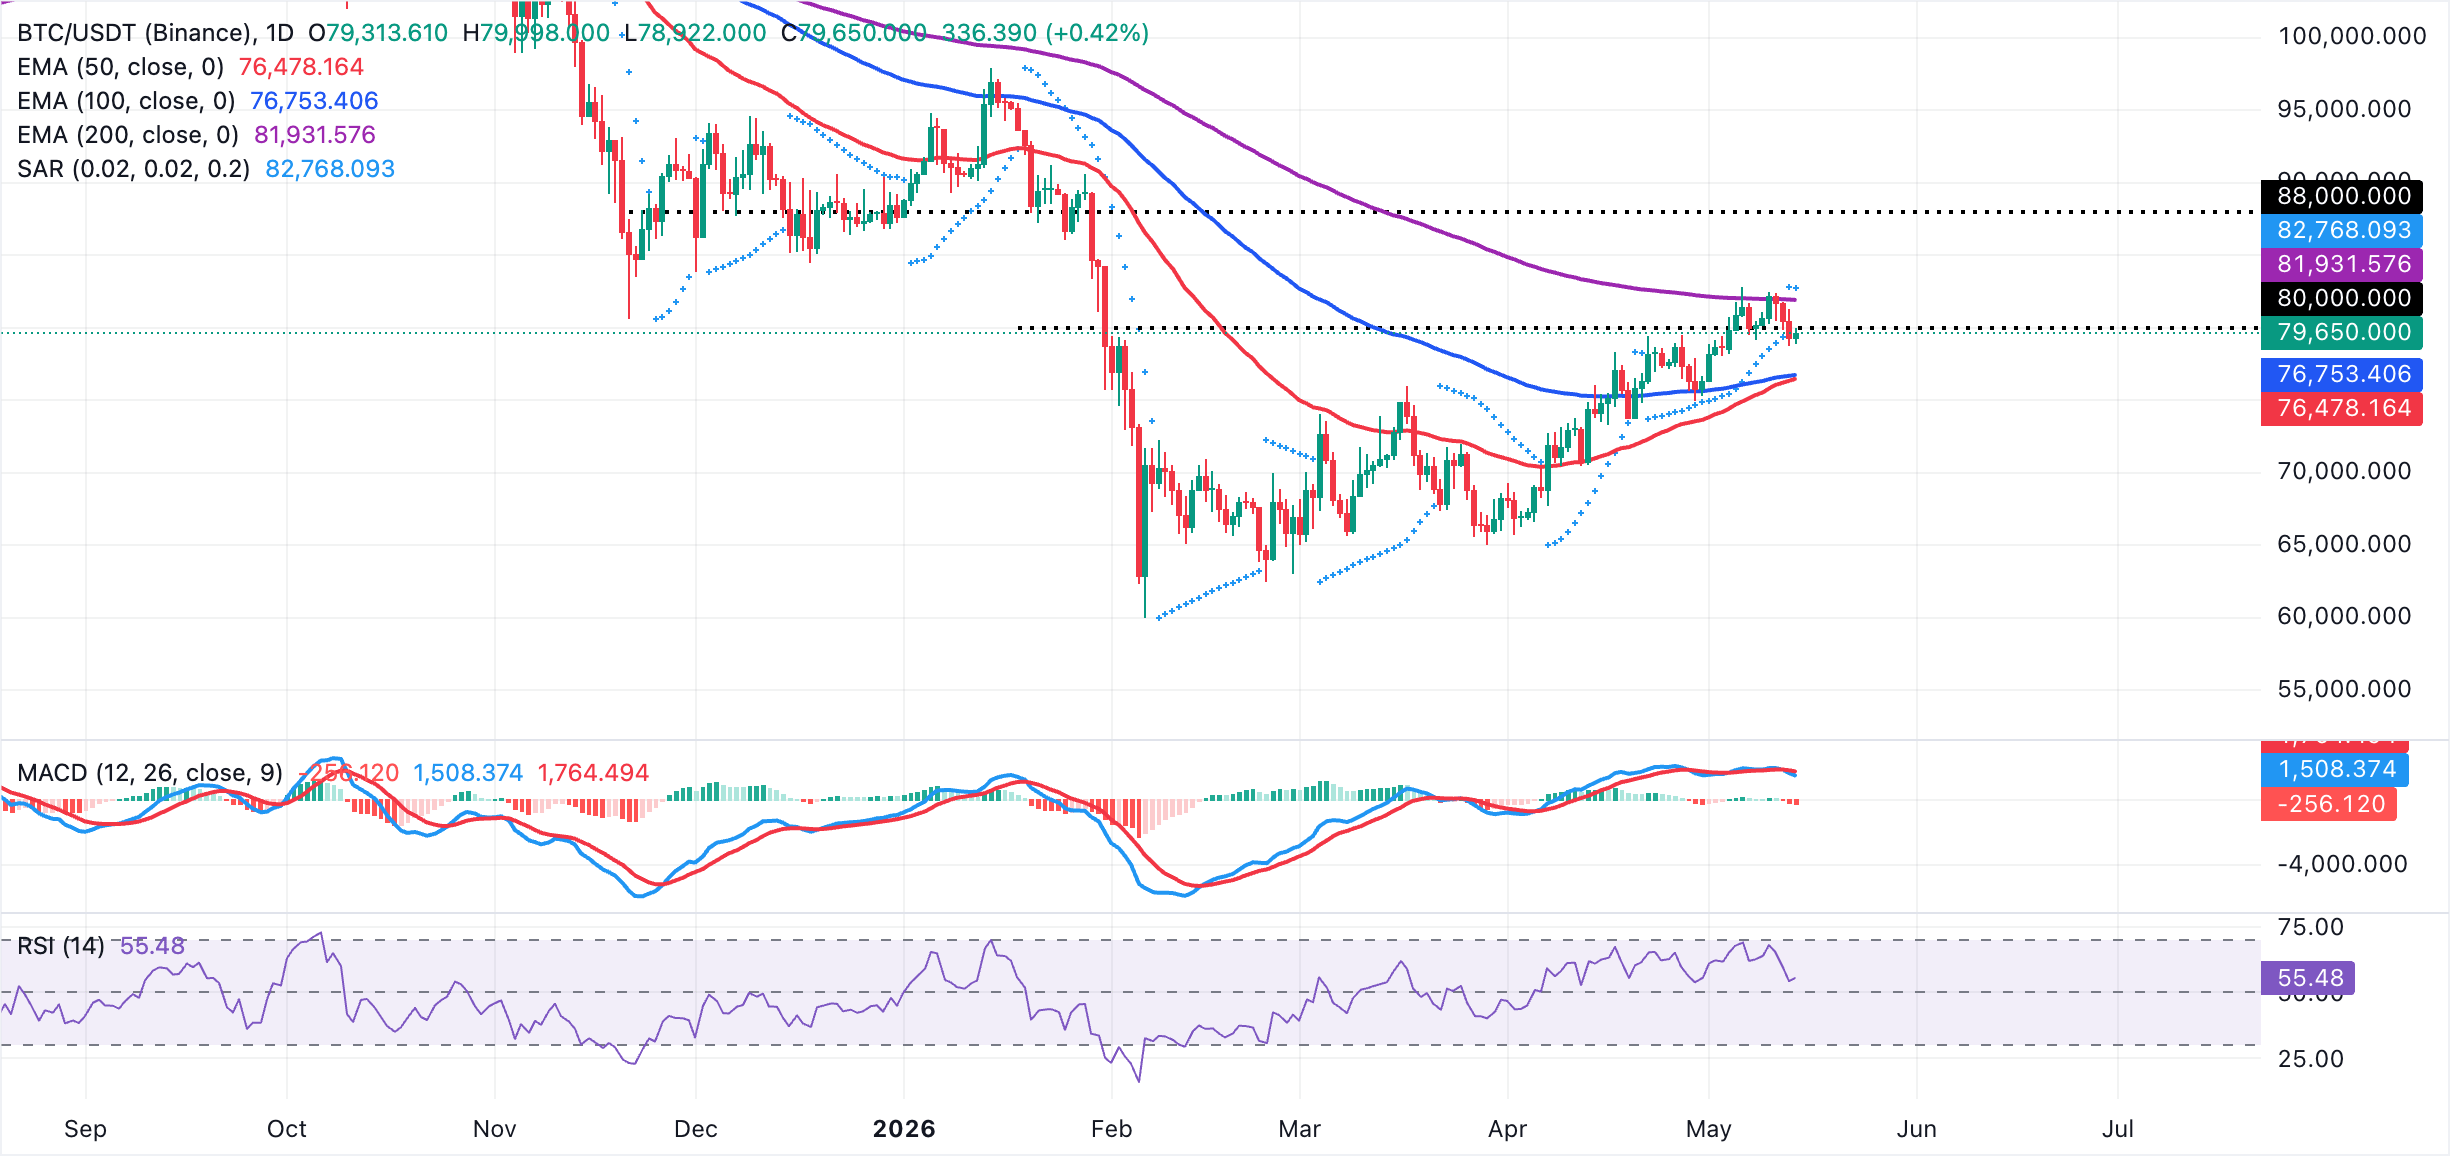
On the topside, immediate resistance emerges at the 200-day EMA around $81,932, with the Parabolic SAR level at $82,768 providing a higher barrier that, if reclaimed, would open the way for a more sustained bullish extension. On the downside, initial support is seen at the 100-day EMA near $76,753, followed closely by the 50-day EMA around $ 76,478. A break back below this zone would weaken the current positive structure and expose a larger corrective risk.
Altcoins technical outlook: Ethereum and XRP hold key support
Ethereum trades at $2,266, keeping a bearish near-term tone as price sits under a dense band of moving-average resistance. The pair has slipped back below the 50-day EMA at $2,274 and remains capped by the Bollinger Bands’ 20-day Simple Moving Average (SMA) around $2,311, with the 100-day EMA higher at $2,339 and the 200-day EMA near $2,583 reinforcing the broader downside bias.
Momentum indicators back this cautious picture, with the RSI hovering just below the 50 line at 46 on the daily chart and the MACD firmly in negative territory, hinting that rallies are likely to fade.
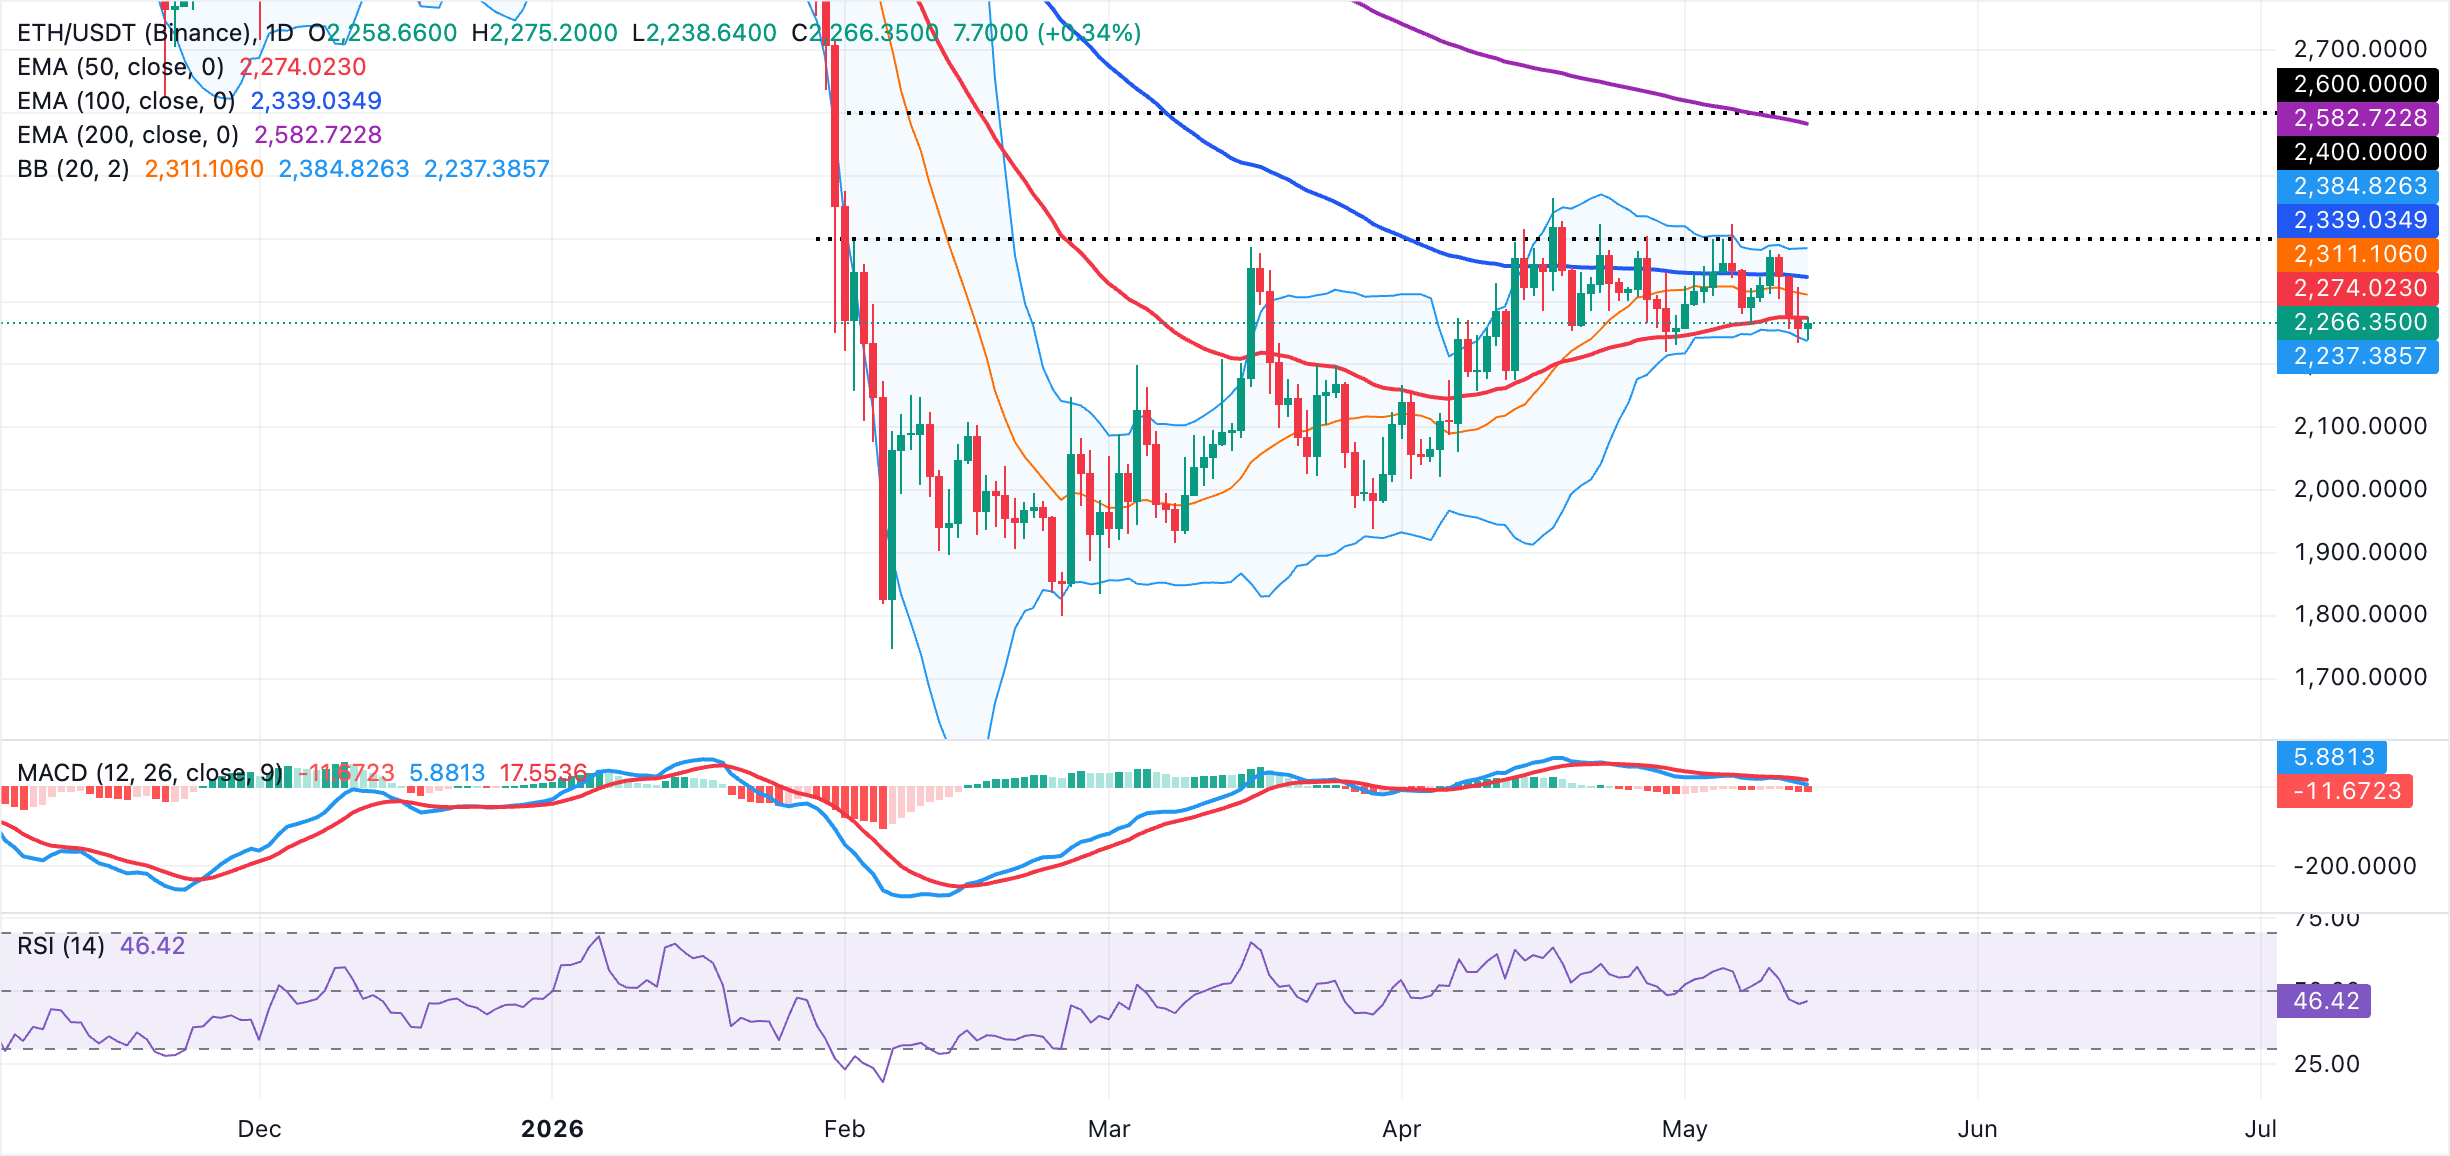
On the topside, immediate resistance lies at the 50-day EMA around $2,274, followed by the Bollinger midline at $2,311 and then the 100-day EMA at $2,339, where renewed selling pressure could emerge. A sustained break above these would be needed to ease the current bearish pressure and expose the upper Bollinger band at $2,384 before the more distant 200-day EMA near $2,583.
On the downside, initial support is seen at the lower Bollinger band around $2,237. A clear daily close below this floor would likely confirm the continuation of the prevailing corrective phase and open the door to deeper losses in the upcoming sessions.
XRP, on the other hand, trades at $1.43, holding a neutral-to-bullish near-term tone as it consolidates above the 20-day Bollinger middle band around $1.41 and the 50-day EMA near $1.42. Still, the pair remains capped beneath higher-timeframe trend references, with the 100-day EMA at $1.49 and the 200-day EMA roughly at $1.71 reinforcing a broader topside constraint.
Momentum indicators are mildly constructive, as the RSI hovers at 53 on the daily chart and the MACD histogram holds marginally in positive territory, signaling that buyers retain a slight edge but lack a decisive breakout trigger.
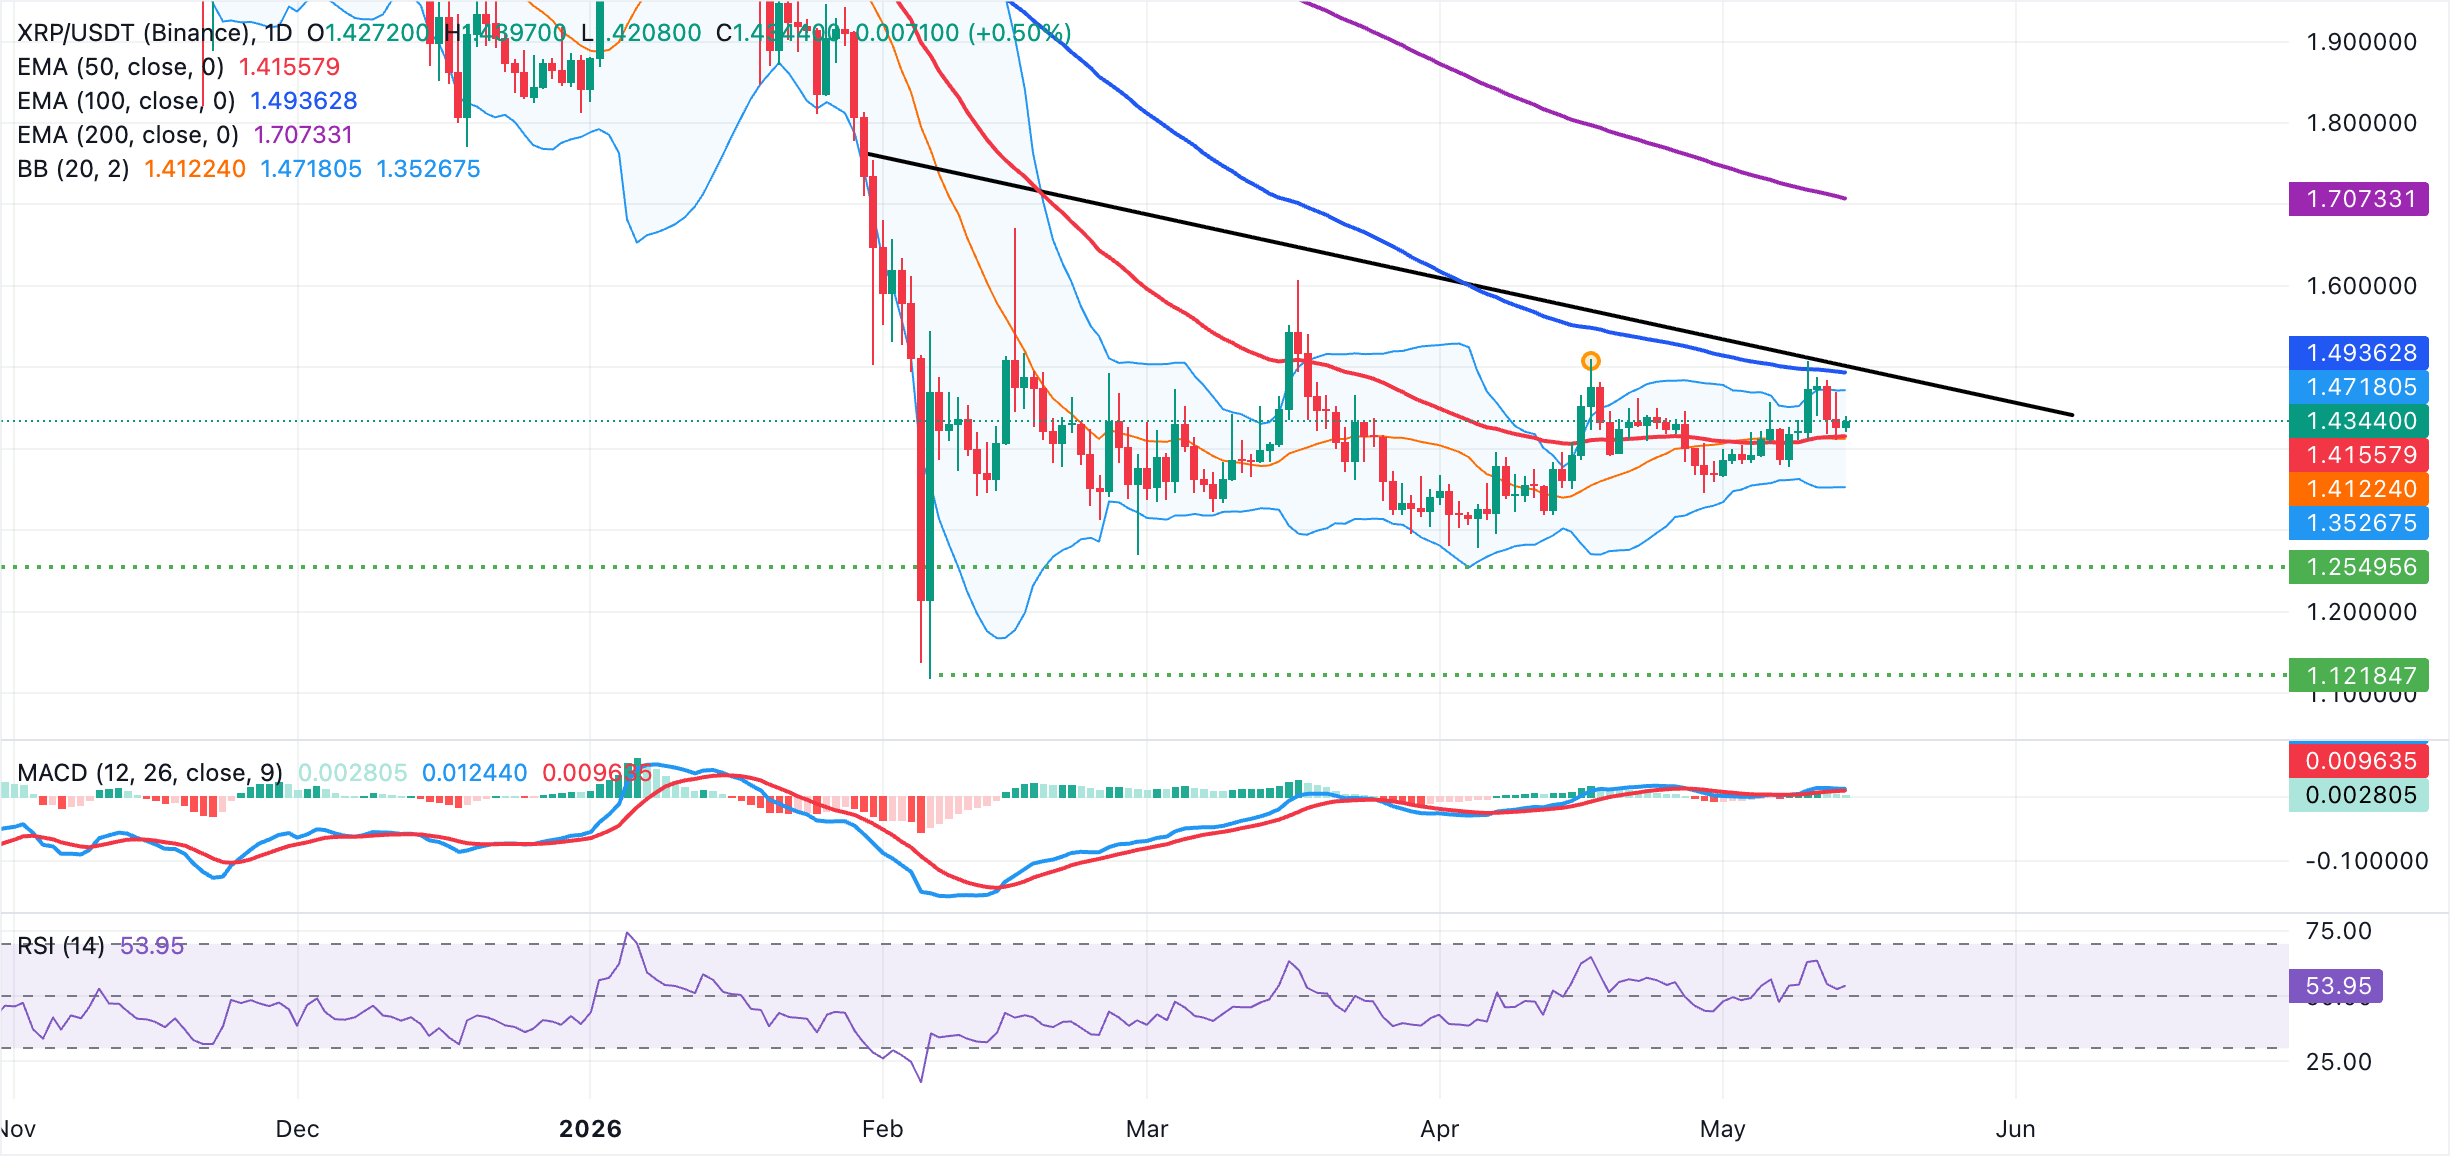
On the topside, initial resistance is seen at the upper Bollinger band around $1.47, where recent gains stalled, followed by the descending trendline barrier projected around $1.50. Other key levels of interest for traders are the 100-day EMA at $1.49 and the more distant 200-day EMA near $1.71.
On the downside, immediate support lies in a tight cluster formed by the 20-day Bollinger middle band and the 50-day EMA in the $1.41 area, with a deeper pullback exposing the lower Bollinger band support near $1.35. Holding above this zone would keep the current consolidation phase slightly biased toward the bulls.
(The technical analysis of this story was written with the help of an AI tool.)
Crypto ETF FAQs
An Exchange-Traded Fund (ETF) is an investment vehicle or an index that tracks the price of an underlying asset. ETFs can not only track a single asset, but a group of assets and sectors. For example, a Bitcoin ETF tracks Bitcoin’s price. ETF is a tool used by investors to gain exposure to a certain asset.
Yes. The first Bitcoin futures ETF in the US was approved by the US Securities & Exchange Commission in October 2021. A total of seven Bitcoin futures ETFs have been approved, with more than 20 still waiting for the regulator’s permission. The SEC says that the cryptocurrency industry is new and subject to manipulation, which is why it has been delaying crypto-related futures ETFs for the last few years.
Yes. The SEC approved in January 2024 the listing and trading of several Bitcoin spot Exchange-Traded Funds, opening the door to institutional capital and mainstream investors to trade the main crypto currency. The decision was hailed by the industry as a game changer.
The main advantage of crypto ETFs is the possibility of gaining exposure to a cryptocurrency without ownership, reducing the risk and cost of holding the asset. Other pros are a lower learning curve and higher security for investors since ETFs take charge of securing the underlying asset holdings. As for the main drawbacks, the main one is that as an investor you can’t have direct ownership of the asset, or, as they say in crypto, “not your keys, not your coins.” Other disadvantages are higher costs associated with holding crypto since ETFs charge fees for active management. Finally, even though investing in ETFs reduces the risk of holding an asset, price swings in the underlying cryptocurrency are likely to be reflected in the investment vehicle too.
Recommended Articles


Comments (0)
Click the $ button, enter the symbol, and select to link a stock, ETF, or other ticker.