


Dogecoin Coils For A Monster 90% Breakout, Analyst Predicts



Dogecoin is trading inside a well-defined falling wedge on the 12-hour chart, with one technical analyst arguing that an upside breakout could trigger an 80–90% rally into the upper $0.20 range. In a fresh DOGE/USDT update shared on November 25, 2025, trader Clifton Fx (@clifton_ideas) posted a Binance 12-hour chart that spans back to late July.
Dogecoin Could Rally Nearly 90%
The chart is dominated by two descending trendlines that enclose price action. The upper boundary connects successive lower highs from early autumn through late November, forming a downward-sloping resistance line now running just above the latest candle around the mid-$0.15 area. The lower boundary links the major swing lows since August, creating a shallower descending support line currently located in the high-$0.12 to low-$0.13 zone. Together they form the falling wedge that Clifton highlights in his caption: “Falling wedge formation in 12h timeframe.”
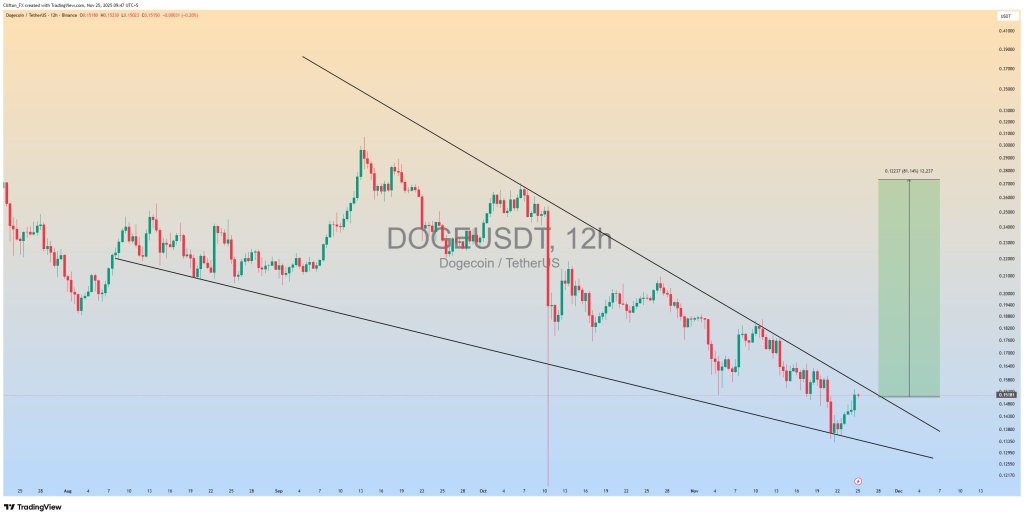
Within this structure, Dogecoin has produced a series of lower peaks and troughs. The October 10 sell-off is marked by a prominent red candle and a thin vertical guide, driving price into the lower boundary before a partial recovery. Through late October and November, DOGE continues to respect the wedge: every rebound stalls beneath the upper trendline, while the sell-offs find support near the lower one.
In mid-November, price again tests that lower boundary, with a wick reaching slightly below the $0.13 region. From there, several consecutive green candles carry DOGE back up toward the upper trendline. The latest candle in the chart is closing in to that resistance, but no clear 12-hour close above it is visible, meaning the wedge remains intact and unbroken in the screenshot.
On the right side of the chart, Clifton Fx plots an upside scenario. A tall, translucent green projection box starts at the current price line near $0.15181. A measurement label attached to the box reads “0.12237 (81.14%) 12,237”, indicating a move of $0.12237, or 81.14%, from that starting point. The top of the green zone aligns just above $0.27000 and below $0.28000, implying a potential target around $0.27.
Summarizing the setup, the analyst writes: “In case of an upside breakout we can see an 80 – 90% massive bullish rally in the next coming days.”
The chart itself, however, is explicitly conditional: the upper wedge line has not yet been broken, and no invalidation level is drawn. For now, Dogecoin is compressed between descending resistance near $0.15 and support above $0.13, with Clifton Fx warning that a clean breakout could quickly reprice DOGE toward the high-$0.20 area.
At press time, DOGE traded at $0.14988.

Recommended Articles









Comments (0)
Click the $ button, enter the symbol, and select to link a stock, ETF, or other ticker.