


$14B In Stablecoins Minted Since October Crash: Liquidity Returning To Crypto



The crypto market remains under intense selling pressure, with sentiment turning increasingly bearish as Bitcoin trades below the $100,000 mark for the first time since May. Altcoins have fared even worse, extending a downtrend that began in early October. Despite this wave of uncertainty and fading bullish momentum, capital inflows into the market continue to grow — suggesting that investors may be preparing for the next phase of accumulation.
Lookonchain reports that stablecoin issuance has surged in recent weeks, led by giants like Tether (USDT) and Circle (USDC). Together, the two firms have minted over $14 billion in new stablecoins since the October 10 market crash.
This growing stablecoin supply often acts as a leading indicator of fresh capital waiting to be deployed. Historically, similar surges in stablecoin minting have preceded market rebounds, as traders and institutions position themselves to buy during periods of weakness.
Circle’s USDC Mint Extends Liquidity Wave Amid Bearish Sentiment
According to data shared by Lookonchain, Circle has just minted another $750 million in USDC, adding to the wave of stablecoin inflows seen across the market in recent weeks. This continues the broader trend of renewed liquidity entering the crypto ecosystem, with both Circle and Tether minting a combined $14 billion since the early October crash. Such activity often signals that capital is being parked on the sidelines, ready to be deployed into risk assets once confidence improves.
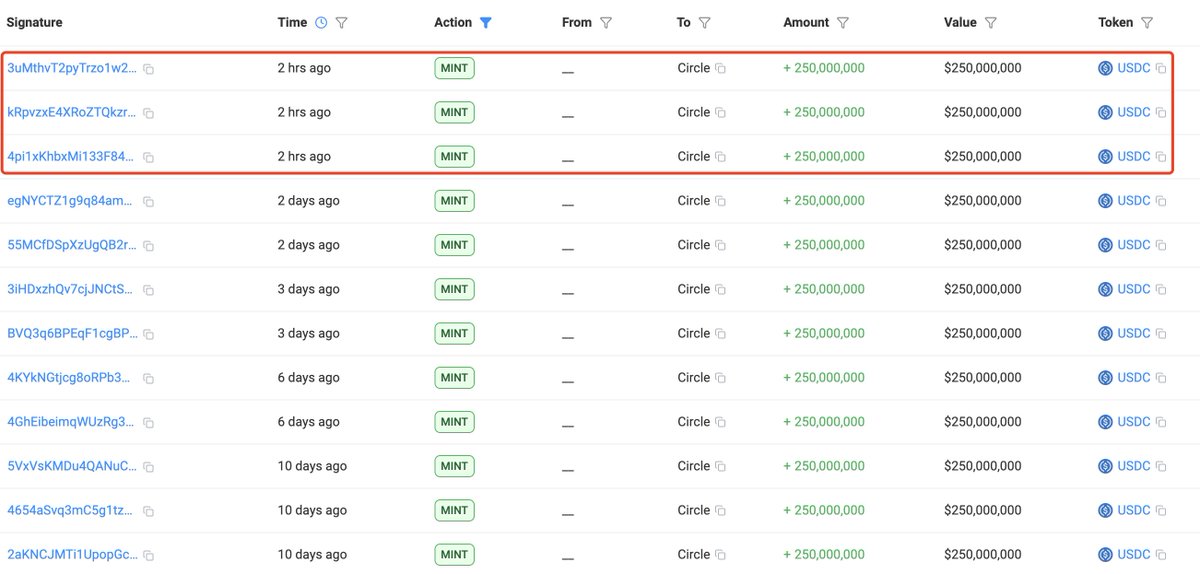
However, despite this rise in liquidity, market sentiment remains highly fearful. Many traders and analysts warn that the persistent selling pressure and failure to hold key psychological levels — particularly Bitcoin’s fall below $100,000 — could mark the beginning of a broader bearish phase. The divergence between liquidity inflows and market performance reflects a complex environment where capital accumulation is not yet translating into buying momentum.
In other words, while the stablecoin supply acts as the dry powder needed for a potential rebound, fear continues to dominate trading behavior. Whether this recent USDC minting fuels a recovery or simply cushions further downside will depend on how macro conditions evolve and whether institutional demand reemerges to absorb the current supply overhang.
USDC Dominance Climbs as Investors Seek Stability Amid Market Fear
The chart shows USDC dominance rising steadily since mid-2024, now hovering around 2.33%, its highest level in nearly a year. This uptrend signals a growing preference for stability among crypto investors amid intensifying market volatility and declining risk appetite. As Bitcoin trades below $100,000 and altcoins continue to bleed, many traders are rotating their holdings into stablecoins like USDC to preserve capital.
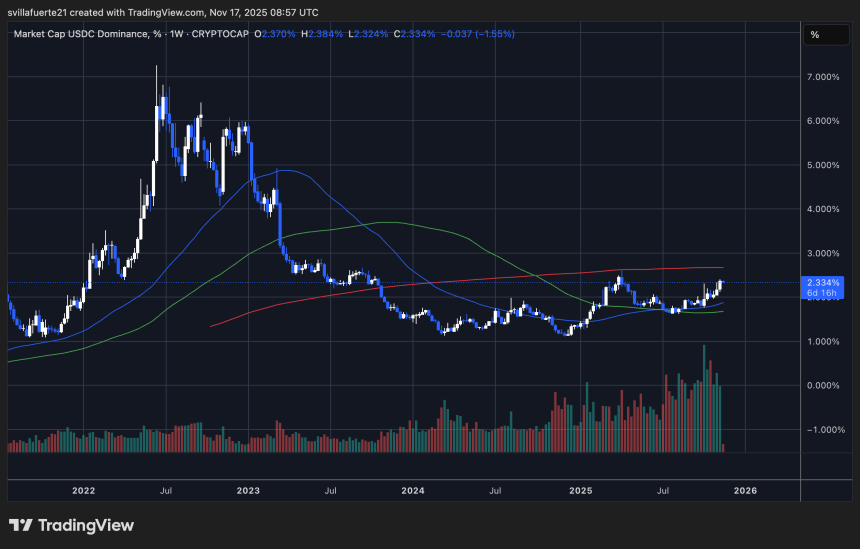
From a technical perspective, USDC dominance has broken above its 50-day and 100-day moving averages, indicating a shift in momentum toward capital preservation. Historically, such climbs in stablecoin dominance occur during correction or consolidation phases, when liquidity exits speculative assets and moves into safer reserves.
The recent $750 million USDC mint by Circle, coupled with rising on-chain stablecoin balances, reinforces this defensive market posture. While this influx boosts available liquidity, it also reflects widespread caution — investors are holding fire, waiting for clearer signals before reentering risk assets.
If USDC dominance continues to climb, it may suggest further downside pressure across the crypto market. However, once dominance plateaus or declines, it could mark the early stages of a market rotation — signaling that stable liquidity is preparing to flow back into Bitcoin and altcoins.
Featured image from ChatGPT, chart from TradingView.com
Recommended Articles









Comments (0)
Click the $ button, enter the symbol, and select to link a stock, ETF, or other ticker.