


Bitcoin Historical Pattern Repeats: 30-Day Funding Rate Signals Uptrend Continuation



Bitcoin has been flirting with a breakout above its all-time high since last week, briefly pushing above the $110,000 level but failing to secure a firm close above it. Despite the pullbacks, bulls remain in control, with price action consistently defended above the $105,000 mark—a key support level now acting as a foundation for further upside. This resilient structure suggests that a bullish continuation could soon follow, especially if buying momentum returns in the days ahead.
Top analyst Axel Adler shared a compelling signal from the 30-day percentile funding rate across major exchanges. According to his analysis, every time this metric dropped to the 50% level, it marked a local bottom. Each occurrence was followed by a significant trend reversal and resumption of the broader uptrend.
As long as funding remains neutral and the price stays above $105K, Bitcoin appears primed for another leg higher. The breakout above all-time highs may just be a matter of time.
Bitcoin Funding Rate Patterns Signal Strength
Bitcoin is preparing for a major move as it continues to test the area just below its $112,000 all-time high. While bulls remain in control, the lack of follow-through above this critical level has fueled speculation about a possible pullback. Some analysts warn that if BTC fails to break into price discovery soon, it could trigger a sharp correction, potentially sending the price below the $100,000 mark. This growing uncertainty coincides with the broader market cooling off after months of volatility.
Interestingly, US stocks are trading at all-time highs, and macroeconomic pressures have begun to ease following six months of instability. Inflation appears to be stabilizing, and investors are regaining confidence across risk-on assets. This shift supports Bitcoin’s bullish long-term thesis, but short-term risks remain in focus.
Axel Adler offers a key insight that adds perspective to the current setup. He highlights a consistent pattern in the 30-day percentile funding rate across major exchanges. Each time the metric dropped near the 50% level—seen in September 2023, May 2024, September 2024, and April 2025—it marked a local bottom followed by a strong rally. The last instance in April 2025 preceded a surge to $112K. Currently, the percentile stands at 54%, indicating sustained bullish momentum.
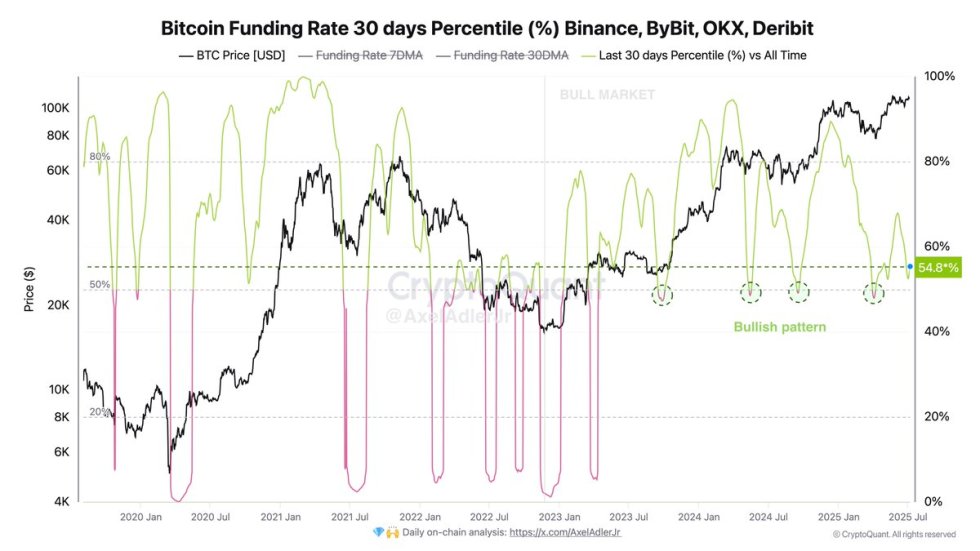
However, caution is warranted. If the metric rises toward the 80% level, it could indicate excessive leverage and foreshadow a correction. Until then, Bitcoin appears well-positioned, but its fate depends on whether bulls can finally push it into price discovery, or whether the hesitation opens the door to a larger retrace.
BTC Consolidates Near Resistance: Breakout Looks Imminent
Bitcoin continues to show resilience near its all-time highs, with the price currently trading around $108,790 on the 12-hour chart. The $109,300 level remains a stubborn resistance zone, having been tested multiple times since May but not yet convincingly broken. However, bulls have repeatedly defended the $103,600 support zone, which aligns with previous consolidation areas and psychological significance. This tight range, between $103,600 and $109,300, has formed a multi-week consolidation pattern, hinting at an imminent breakout.
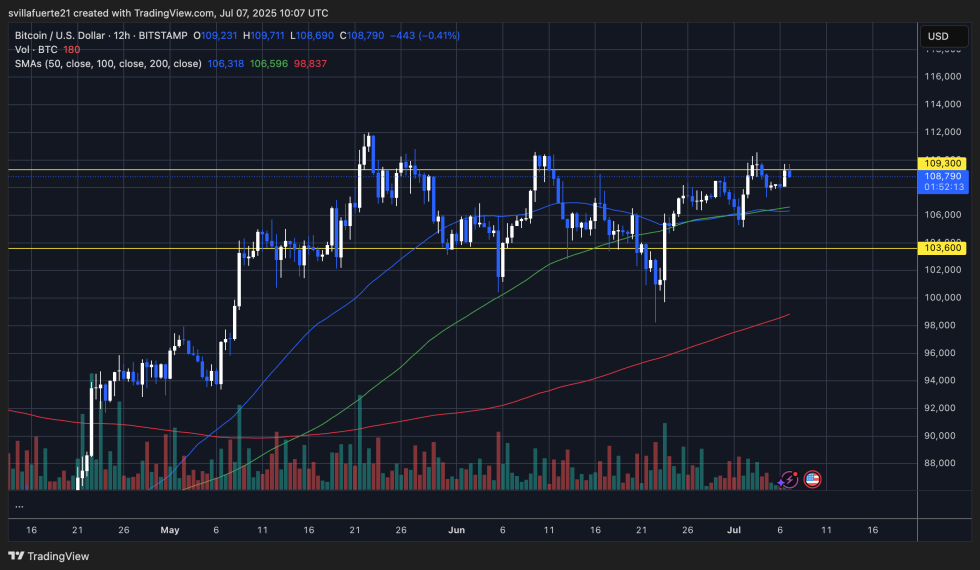
The 50 and 100 simple moving averages (SMAs), currently at $106,318 and $106,596, respectively, are trending upward and providing near-term support. The 200 SMA, located at $98,837, sits far below the current price and highlights the strength of the ongoing macro uptrend. Volume remains relatively neutral, with no signs yet of a major breakout or breakdown, though volatility has compressed slightly, often a precursor to larger moves.
If Bitcoin breaks and holds above $109,300, it could quickly accelerate toward new highs and enter price discovery. On the other hand, failure to sustain this level might trigger another retest of $106,000 or even the $103,600 base support. With macro conditions stabilizing and bullish sentiment returning, the next few sessions may decide Bitcoin’s near-term direction.
Featured image from Dall-E, chart from TradingView
Recommended Articles








Comments (0)
Click the $ button, enter the symbol, and select to link a stock, ETF, or other ticker.