


Bitcoin Weekly RSI Climbs Toward Upper Boundary – Will BTC Bulls Push Through?



As Bitcoin (BTC) continues to grind through the $100,000 to $110,000 range, its weekly Relative Strength Index (RSI) is steadily climbing toward the upper trendline – fuelling hopes for a bullish breakout and the potential for a new all-time high (ATH) in the near term.
Bitcoin RSI Pushing Toward Upper Trendline
In an X post published today, seasoned crypto analyst Titan of Crypto remarked that Bitcoin “still has fuel in the tank.” The analyst shared the following BTC weekly chart, highlighting that the digital currency’s market structure remains strong, marked by a series of higher highs and higher lows.
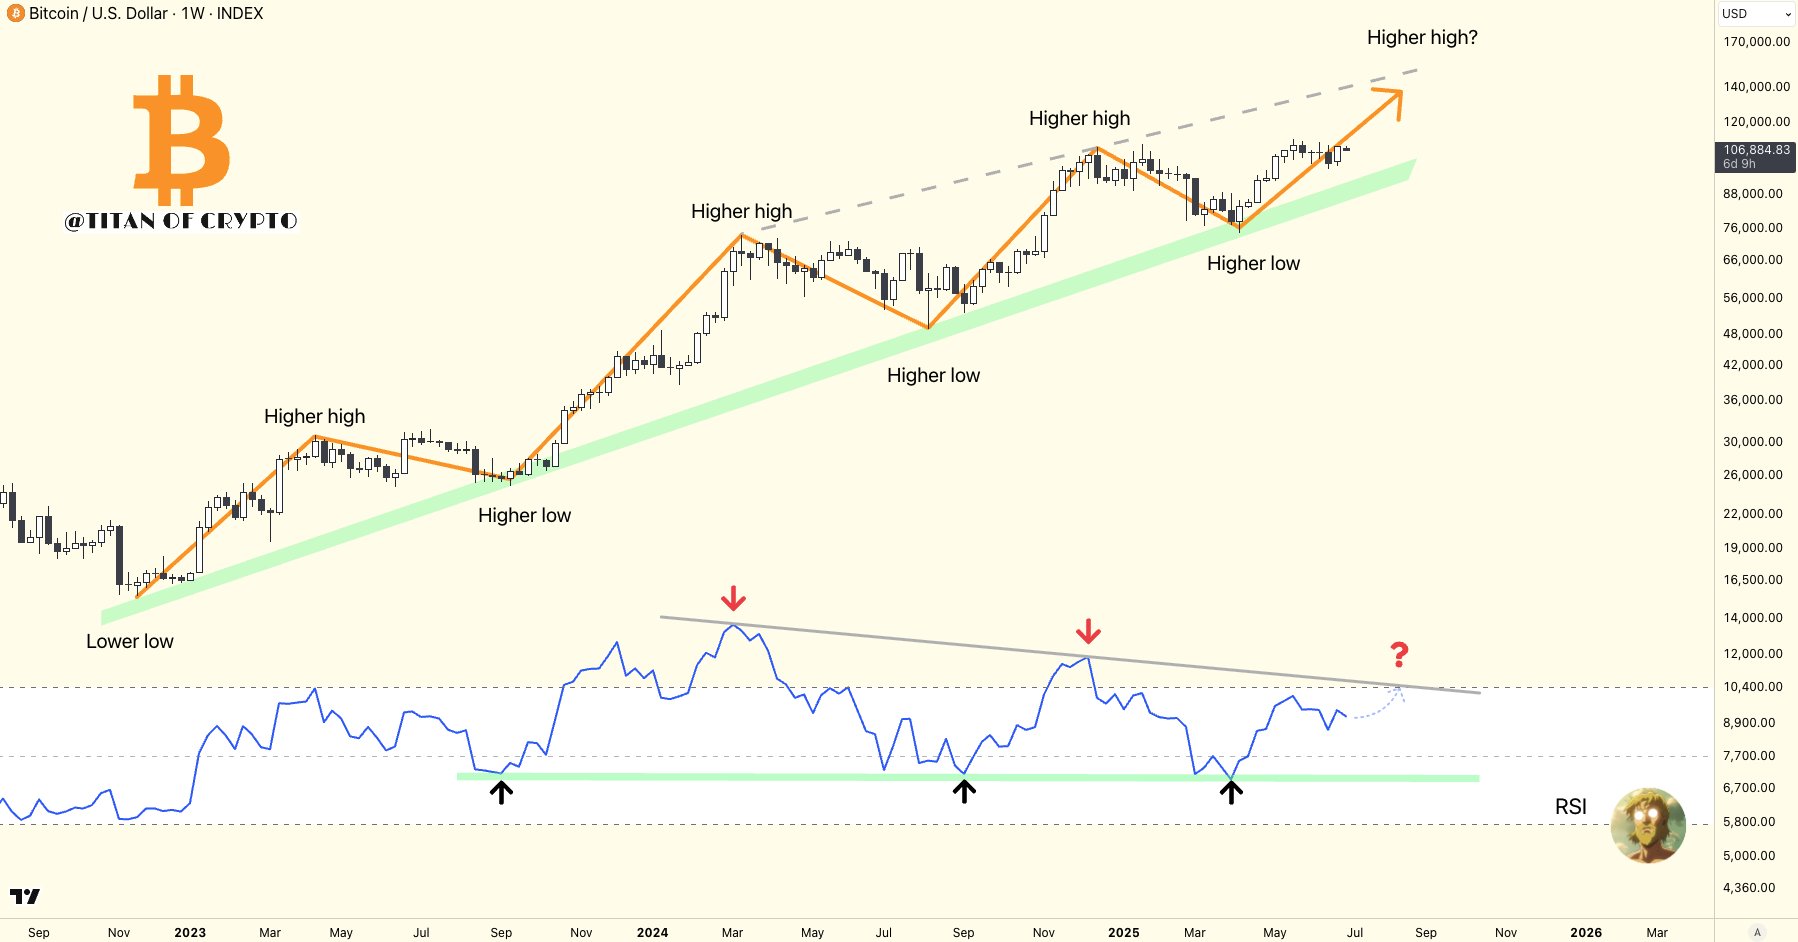
According to Titan of Crypto, Bitcoin’s weekly RSI is approaching its upper trendline after rebounding from the lower end of the range in April 2025. Historical data shows that BTC price has often peaked whenever the weekly RSI touched this upper boundary.
For context, the RSI is a momentum indicator that measures the speed and magnitude of the underlying asset’s price movements. It ranges from 0 to 100, with values above 70 typically indicating overbought conditions and those below 30 suggesting oversold territory.
If BTC mirrors its historical patterns – rallying alongside a rising weekly RSI – it could be on track for a new ATH of around $140,000. As of now, BTC is trading approximately 4.7% below its current ATH of $111,814, set on May 22.
BTC Looks Bullish On Monthly Timeframe
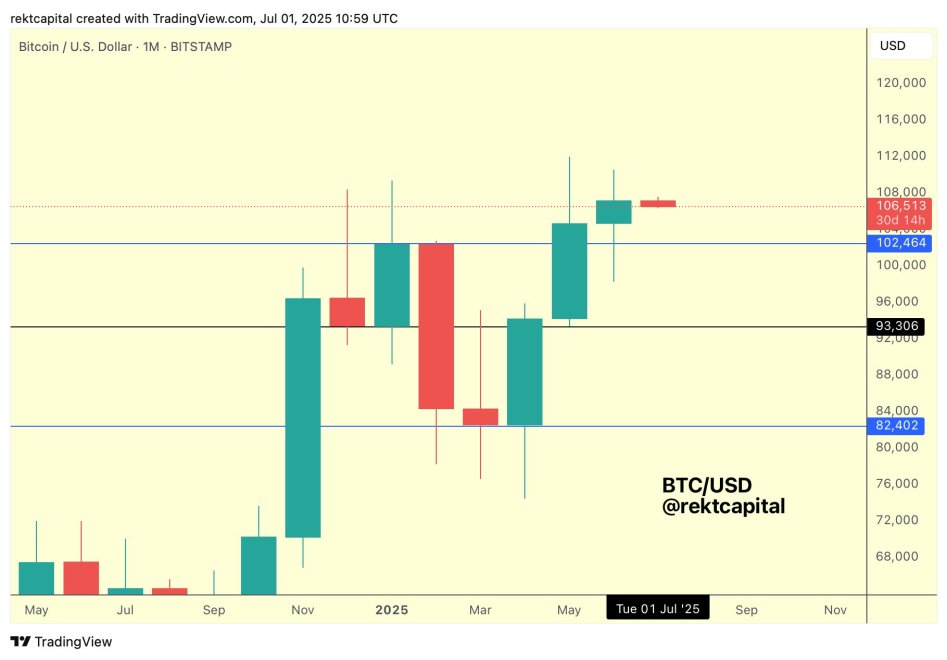
Other prominent analysts are also pointing to potential upside for the world’s largest cryptocurrency by market cap. For example, Rekt Capital shared the following BTC monthly chart, noting that Bitcoin has “fully confirmed” a breakout from its monthly range. The analyst added:
Thus, now is the time for buy-side volume to step in to facilitate trend continuation. Until that volume comes in however, it wouldn’t be out of the ordinary for additional retesting of the blue Range High to occur to grab extra buy-side liquidity in an effort to fuel the next uptrend.
Similarly, analyst Jelle highlighted a bullish setup on Bitcoin’s chart, noting a bullish engulfing candle and a potential breakout from a symmetrical triangle structure. They also pointed out that BTC might benefit from a negative funding rate.
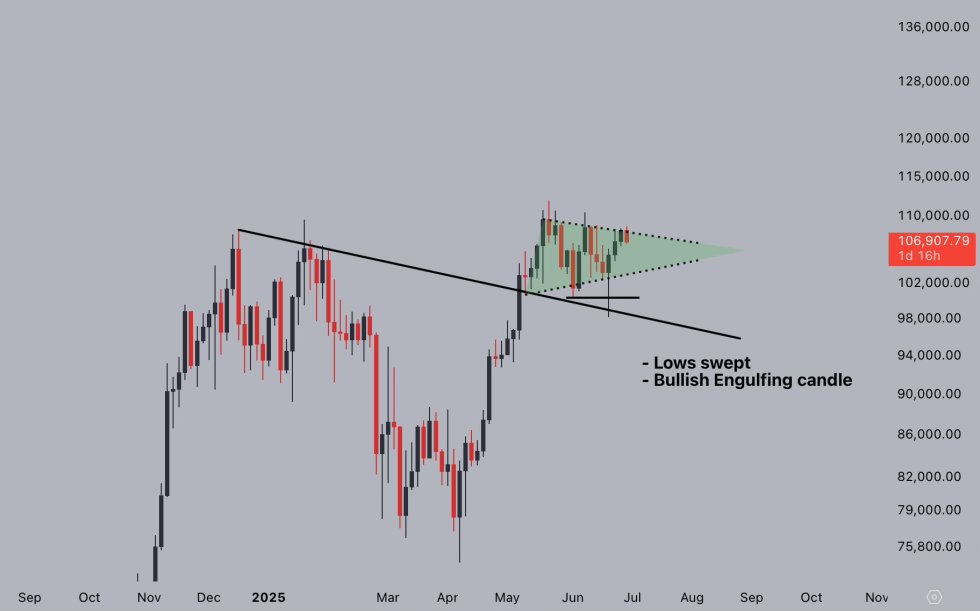
For the uninitiated, a negative funding rate means short traders are paying long traders, indicating bearish sentiment in the market. This can be bullish for Bitcoin, as it raises the chances of a short squeeze and a potential price rebound.
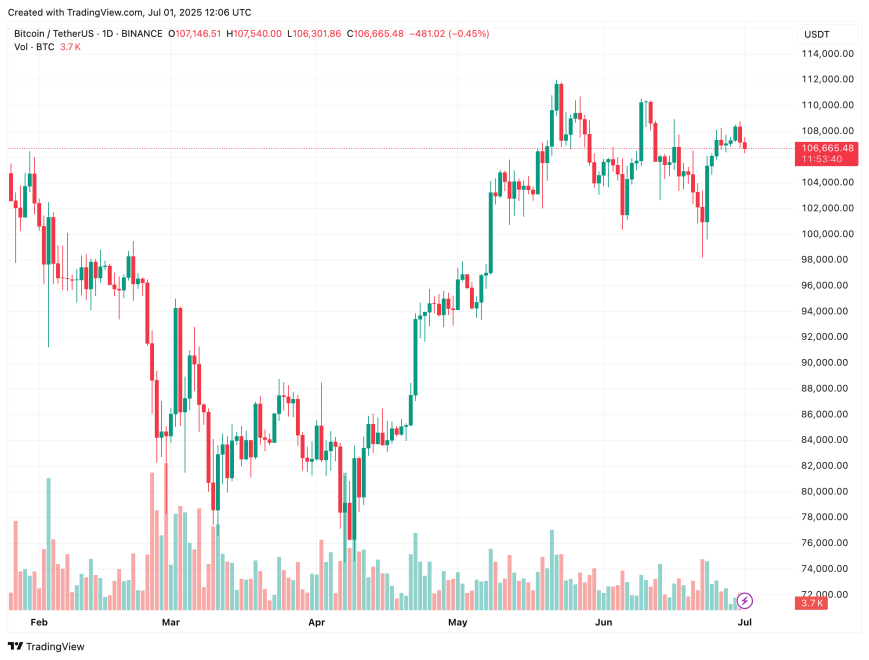
That said, investors should remain cautious and watch for signs of bull market fatigue, which could lead to a short-term pullback. At press time, BTC is trading at $106,665, down 1% over the past 24 hours.
Recommended Articles









Comments (0)
Click the $ button, enter the symbol, and select to link a stock, ETF, or other ticker.