Computers, Phones & Household Electronics
LIST1085Related Stocks
News
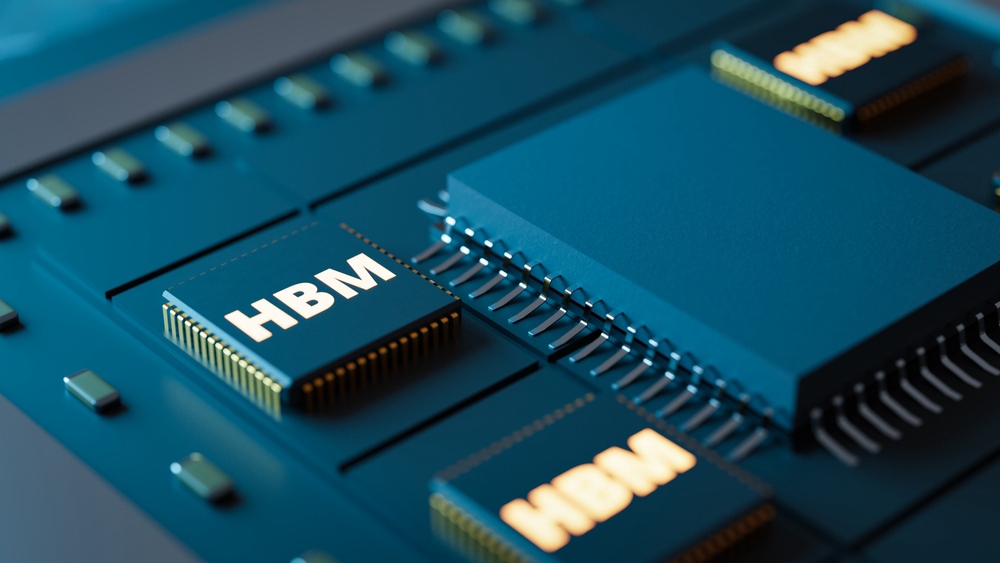
2026 Global Top Seven Memory Giants Ranking: Kioxia, SanDisk Lead Growth, Who Is Strongest in the AI Memory Supercycle?
TradingKey - Since the start of 2026, the Philadelphia Semiconductor Index (SOX) has risen by nearly 90%, with memory chips serving as the primary driving force. Against the backdrop of the index's upward trajectory, the market capitalizations of the DRAM "Big Three" have successively surpassed $1 trillion. In the NAND sector, two individual stocks have surged over 45-fold in the past year, while hard disk drive (HDD) manufacturers have also experienced a valuation re-rating fueled by AI data storage demand. So, which has been the top performer in this round of the AI storage supercycle?
Memory Giant Kioxia’s US IPO: Key Information You Need to Know
TradingKey - On May 15, 2026, Japanese memory giant Kioxia Holdings officially announced its plans to list American Depositary Shares (ADS) on a U.S. stock exchange. Over the past year or so, this Toshiba "castoff" specializing in NAND flash memory has staged a meteoric rise from its rock bottom. Just 18 months post-listing, Kioxia's share price has surged over 62-fold cumulatively, with its total market capitalization surpassing Toyota to claim the top spot in the Japanese stock market.
US Pre-Market: US-Iran Deal Hedges Hawkish Fed. Three Major Index Futures Rebound, Intel Rises Over 9%, AI Chip Stocks Rally
TradingKey - On Thursday Eastern Time, futures on the three major US stock indexes rose in unison in pre-market trading, as market sentiment recovered significantly from the previous trading session. Although Federal Reserve Chairman Kevin Warsh struck a hawkish tone after his first policy meeting, prompting the market to reprice the risk of rate hikes this year, an interim agreement signed between the US and Iran and improved shipping expectations in the Strait of Hormuz continued to weigh on international oil prices, easing concerns over energy inflation and boosting risk appetite for tech stocks.

Trump Announces Apple and Intel Reach US Domestic Chip Partnership, Intel Surges Over 9% Pre-Market
TradingKey - U.S. President Trump made a blockbuster announcement on his personal social media platform Truth Social on Thursday, declaring that Apple (AAPL) has officially reached a partnership agreement with Intel (INTC) to jointly conduct chip design and manufacturing operations domestically in the United States. Following the news, Intel shares surged over 9% in pre-market trading.

Will Your Next iPhone Cost More? Cook Admits: Memory Chips Are Too Expensive
TradingKey - According to a Wall Street Journal report, Apple CEO Tim Cook admitted in an interview that as memory and flash memory prices continue to rise, it has become difficult for the company to fully absorb the costs, making future product price increases "inevitable."
Apple (AAPL) Holds $299 Ahead of FOMC — Can Warsh’s Decision Trigger a Rally to $317?
TradingKey - Apple AAPL at $298.99, consolidating at EMA50 in ascending channel ahead of the Warsh FOMC decision. Q2 FY2026: $111.2B revenue, Services $31B ATH. RSI 53.54 neutral. Fib target $317.45.