


Applied Materials Expects Over 30% Chip Equipment Growth in 2027, but AMAT Stalls Below $405.45



AI Podcast


Applied Materials reported record fiscal fourth-quarter revenue of $10.41 billion and non-GAAP EPS of $4.16, alongside a strong fiscal first-quarter guidance driven by AI-fueled semiconductor demand. Despite beating estimates and issuing an anticipated 2027 outlook, the stock remained muted after hours, as recent rebounds likely priced in the positives and supply constraints linger. Technically, the stock maintains a cautiously neutral bias while trading below the key $405.45 resistance level. A daily close above this barrier would break the prevailing falling channel and potentially target $475.05, whereas a rejection risks pushing the stock back toward support at $317.34.
TradingKey - Applied Materials (NASDAQ: AMAT) fell 3.58% to $380.95 on Thursday, November 12, ahead of its fiscal fourth-quarter report after the close. The results beat estimates, but the stock rose only about 0.5% after hours, and overnight trading is nearly flat at $381.81.
The report followed a sharp rebound this month. In October, the stock fell about 17% in the week of Applied's investor day, when the company gave no 2027 outlook. This time it did, and the market still held back.
A Record Quarter Beat on Revenue and Earnings
Revenue rose 53% to a record $10.41 billion, above the $10.30 billion expected, and non-GAAP EPS, which excludes items such as stock-based pay, jumped 92% to $4.16 against $4.06. Non-GAAP gross margin, the share of revenue left after production costs, rose to 50.6%, and the operating margin hit a record 35.3%.
Semiconductor Systems, which sells chipmaking equipment, grew 64% to $8.0 billion, and the services business grew 26% to $1.9 billion. Free cash flow, the cash left after running the business and paying for new equipment and buildings, reached $2.6 billion for the quarter and $6.2 billion for the year. Applied returned $2.4 billion to shareholders in the quarter, including $2 billion of buybacks.
The 2027 Outlook Applied Held Back in October
Management now expects wafer fab equipment spending, the industry's total spending on chipmaking machines, to grow more than 30% in 2027. Applied plans to double systems output from fourth-quarter 2026 levels by 2028 and to more than double manufacturing and lab capacity by 2030. China should fall below 25% of its business in 2027. CEO Gary Dickerson said "AI is driving a multi-year expansion in semiconductor demand," and CFO Brice Hill said cloud capex is expected to rise more than 50% in 2027 to well over $1 trillion.
For the fiscal first quarter, Applied guided revenue to $11.1 billion, plus or minus $500 million, about 58% growth, and non-GAAP EPS to $4.35, plus or minus $0.20. That quarter has 14 weeks instead of the usual 13, which flatters the comparison.
Why a Strong Guide Barely Moved the Stock
A beat, a 58% revenue guide and the 2027 view investors had waited for should have lifted the stock, yet it gained only about 0.5% after hours. That suggests the November rebound had already priced in much of the good news. Management also said supply pinch points and limited cleanroom space remain constraints, and first-quarter gross margin guidance of about 50.8% is only slightly above the fourth quarter, so the extra week is doing some of the work.
Applied Materials Technical Analysis: Daily Close Above $405.45 Could Open $475.05
That hesitation shows on the daily chart. Thursday's session high of $397.20 stalled just below $405.45, a level that also lines up closely with the upper edge of the falling channel, two parallel lines that have guided prices lower since July. Sellers stepped in right there, so this zone is the key barrier. Even so, the bounce from $317.34 at the channel floor has been solid, and the muted after-hours move leaves the stock below that ceiling.
RSI, a momentum gauge that runs from 0 to 100, sits near 45, still above its signal line. The MACD, another momentum indicator, has just crossed bullish, which shows momentum is slowly improving.
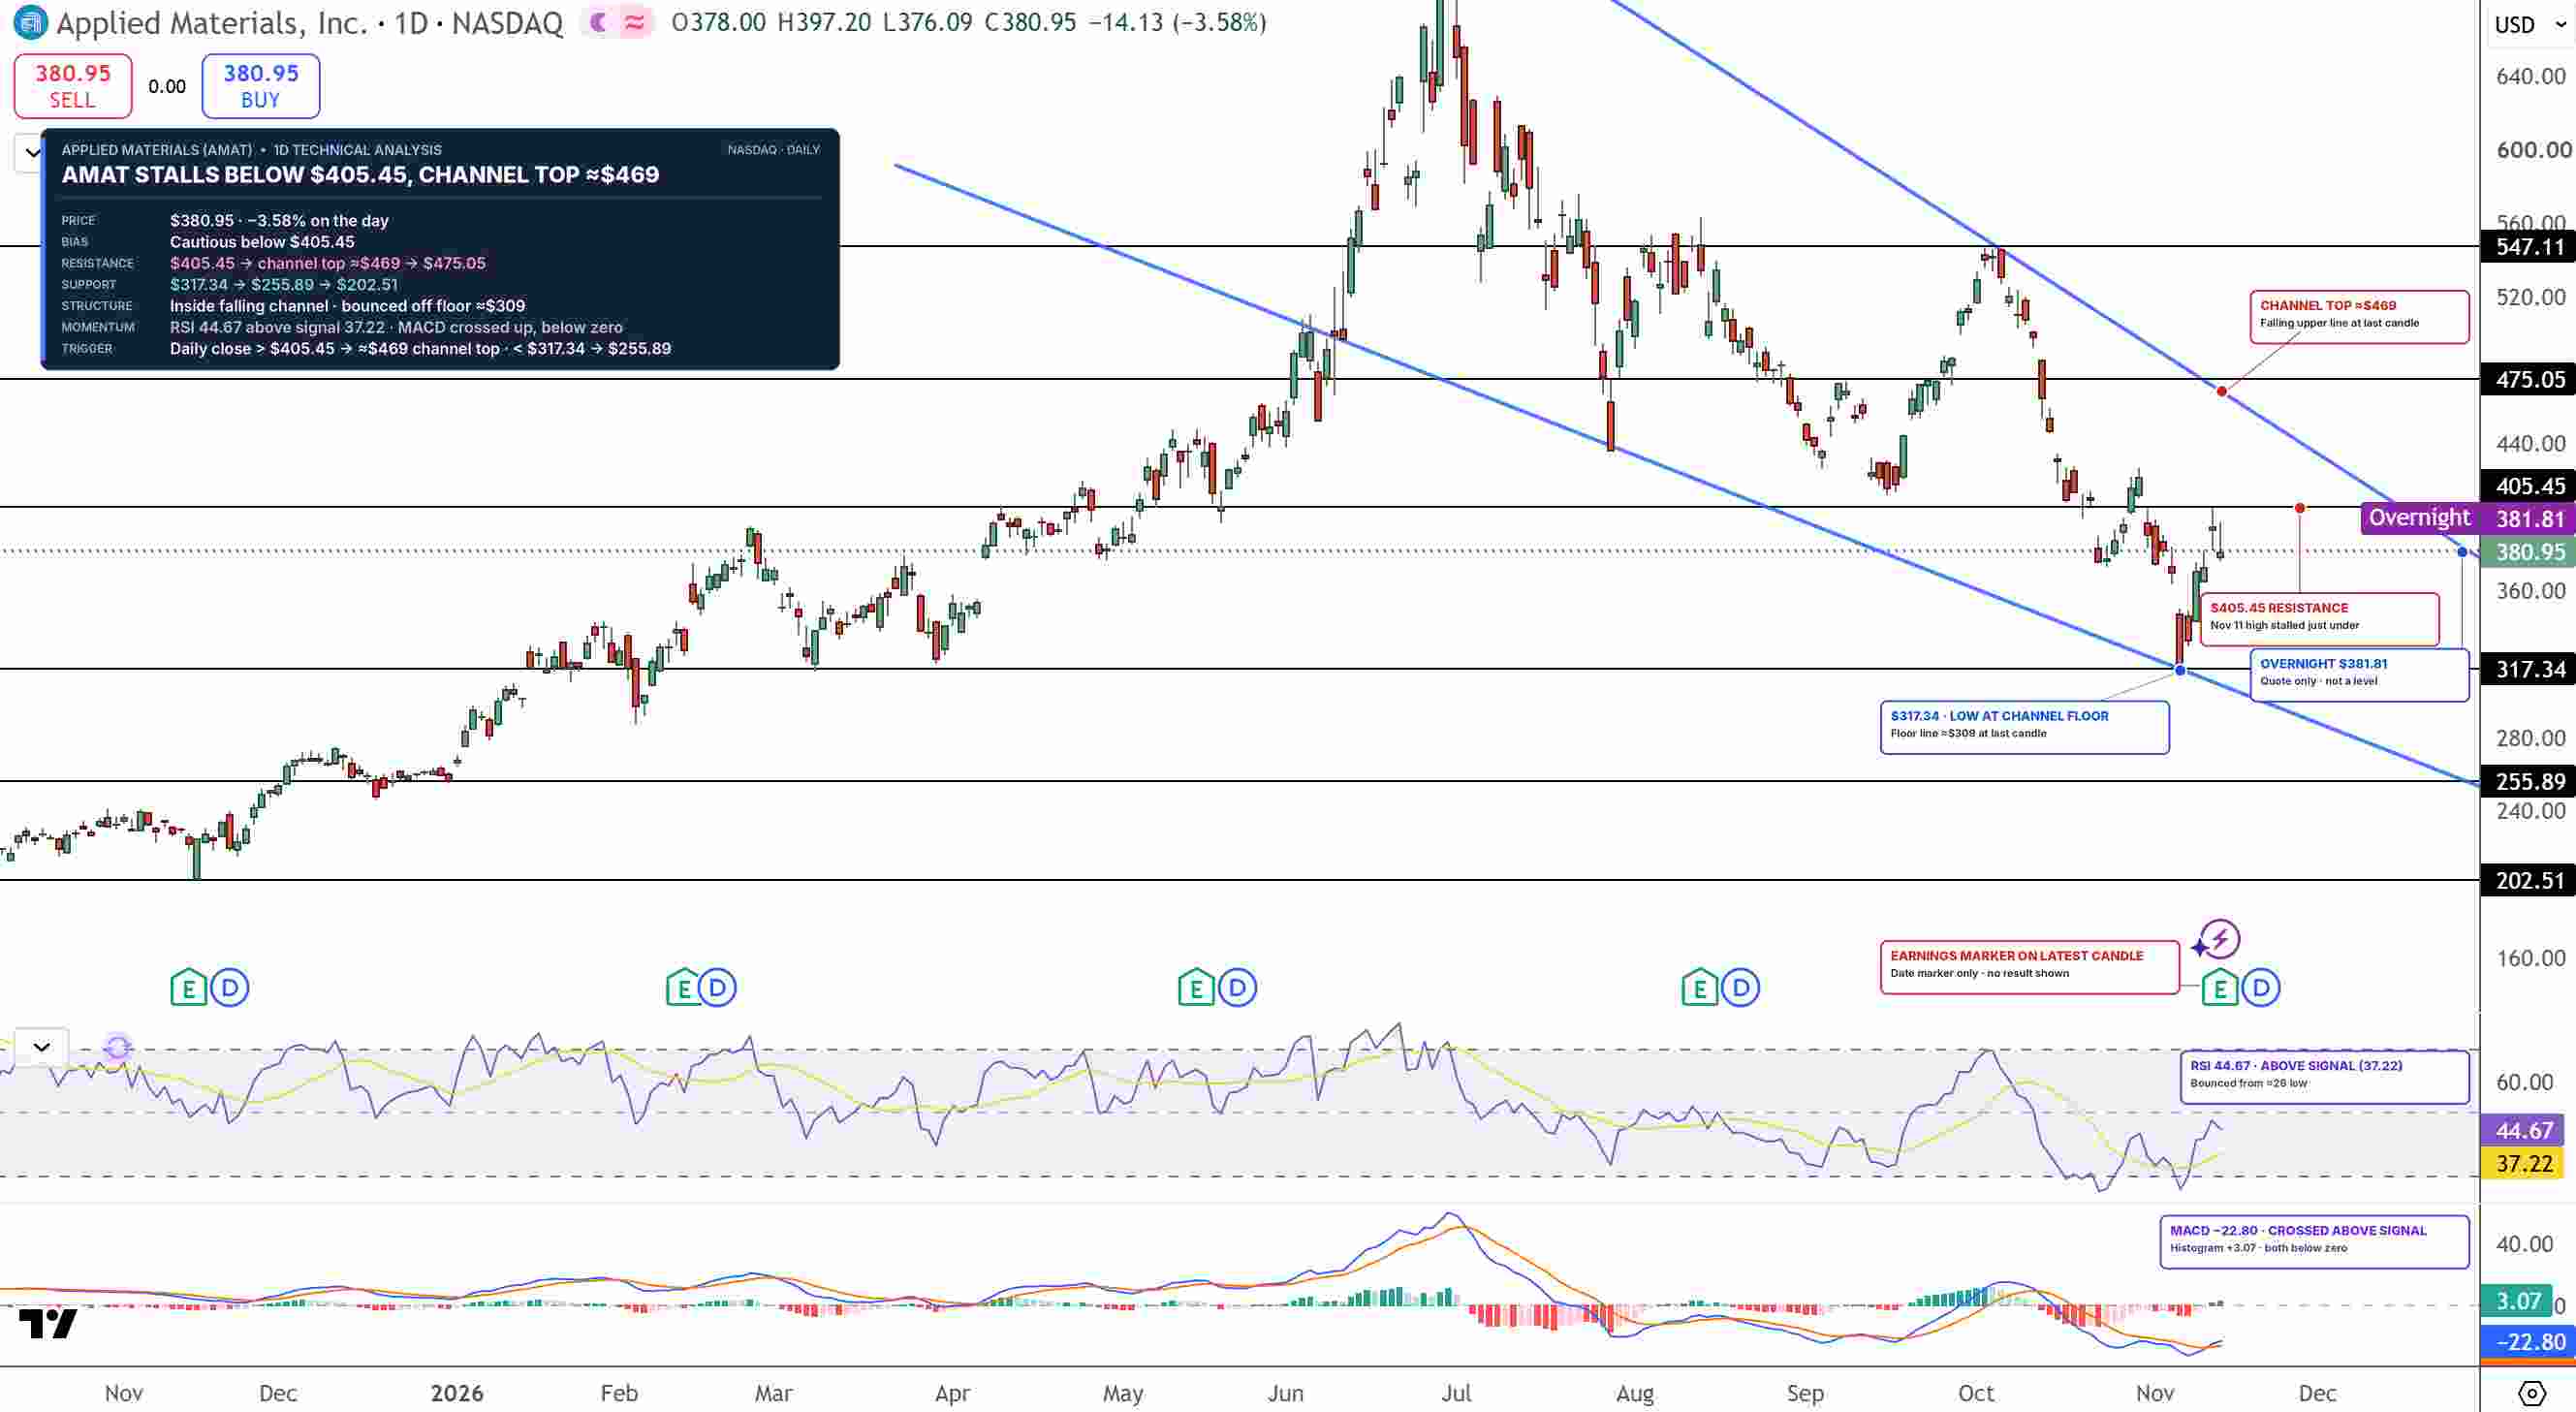
AMAT Price Chart - Source: Tradingview
A daily close above $405.45 would break the channel and could open $475.05. On the downside, a drop back toward $317.34 remains possible if sellers keep control, with $255.89 below that.
I'm cautiously neutral while AMAT trades below $405.45, and a breakout above that level would turn the outlook bullish.
Key Levels
- Last close: $380.95, down 3.58% on Thursday, November 12 (overnight: $381.81)
- Support: $317.34, $255.89
- Resistance: $405.45, $475.05
- RSI: 44.67
- Bullish trigger: Daily close above $405.45
- Bearish trigger: Daily close below $317.34
FAQs
What did Applied Materials report for Q4 2026?
Applied reported record revenue of $10.41 billion, up 53%, and non-GAAP EPS of $4.16, both above estimates. It guided first-quarter revenue to $11.1 billion and expects wafer fab equipment spending to grow more than 30% in 2027.
What is the Applied Materials stock forecast now?
The bias is cautiously neutral below $405.45 on the daily chart. A daily close above $405.45 would break the falling channel and open $475.05, while sellers could push AMAT back toward $317.34.
Bottom Line
Applied finally gave the 2027 view investors wanted, but the stock had already rebounded and the channel ceiling still holds. The level that matters is $405.45. In my view, a daily close above it would end the falling channel and open $475.05, while another rejection there keeps the downtrend in place.
Recommended Articles









Comments (0)
Click the $ button, enter the symbol, and select to link a stock, ETF, or other ticker.