


Boeing Stock Price Forecast: Stock Plunges 10% After Q3 Results, Technicals Signal Another 9% Drop to $155



AI Podcast


On October 27, Eastern Time, Boeing shares plunged 10% intraday to $168.42 following Q3 2026 results. While revenue rose 4% year-over-year to $24.188 billion and operating profit turned positive at $354 million, commercial airplanes remained unprofitable, and defense gains relied on asset sales. A wider-than-expected core loss per share of $0.34 and heavy interest expenses pressured earnings. Technically, the stock broke key support at $176.81, entering a deep Fibonacci retracement zone. Moving averages indicate strong overhead resistance, shifting market focus to historical support levels near $155.78 as structural downtrends persist.

TradingKey - On October 27, Eastern Time, Boeing (BA) saw its stock price plunge as much as 10% intraday after releasing its third-quarter 2026 financial results, hitting a low of $168.42, its lowest level since April 2025. Although growth in defense and services drove revenue up 4% year-over-year, turning operating profit positive and significantly narrowing the net loss, Boeing's commercial airplanes business remained in the red, and defense profit was boosted by gains from asset sales, leaving the sustainability of its earnings recovery still to be observed.
In the third quarter, Boeing reported revenue of $24.188 billion, up 4% year-over-year; GAAP operating profit was $354 million, compared with a loss of $4.781 billion in the same period last year, with the operating margin rising from negative 20.5% to 1.5%. On a non-GAAP basis, core operating profit was $204 million, compared with a loss of $5.049 billion in the prior-year period, with a core operating margin of 0.8%; core loss per share was $0.34, compared with a loss of $7.47 in the same period last year, but wider than the market expectation of a $0.24 loss.
Among these, the commercial airplanes business remained the main drag on performance recovery. Deliveries during the quarter totaled 161 aircraft, up 1% year-over-year, but revenue fell 3% year-over-year to $10.720 billion, reflecting an unfavorable delivery mix. Operating loss was $697 million, compared with $5.353 billion in the same period last year, with operating margin improving from negative 48.3% to negative 6.5%.
The company stated that performance this quarter was also affected by estimated costs related to future production rate adjustments and higher estimated supply chain costs; margin in the prior-year period was impacted by charges on the 777X program, so the year-over-year improvement includes base-effect factors.
Although operating profit turned positive, interest and debt expenses remained a significant burden on net profit. That expense stood at $573 million during the quarter, with net other income of $96 million and income tax benefit of $7 million, leaving the company still recording a net loss in the end.
Overall, Boeing has achieved improvements in operating profit and quarterly cash flow, but losses in commercial airplanes, the interest burden, and the contribution of asset sale gains to profit mean that earnings recovery still requires further operational data for validation.
From a technical standpoint, following today's sharp decline, Boeing's stock price has broken below key retracement support near $176.81, entering a continuation stage of the decline after the previous rebound structure was further damaged. It has now further entered a deep retracement zone between the 0.618 and 0.786 Fibonacci levels. This implies that most of the previous rally's gains have been given back, and the focus of analysis should shift from "whether the pull-back can end" to "whether historical support zones below can re-establish buying demand."
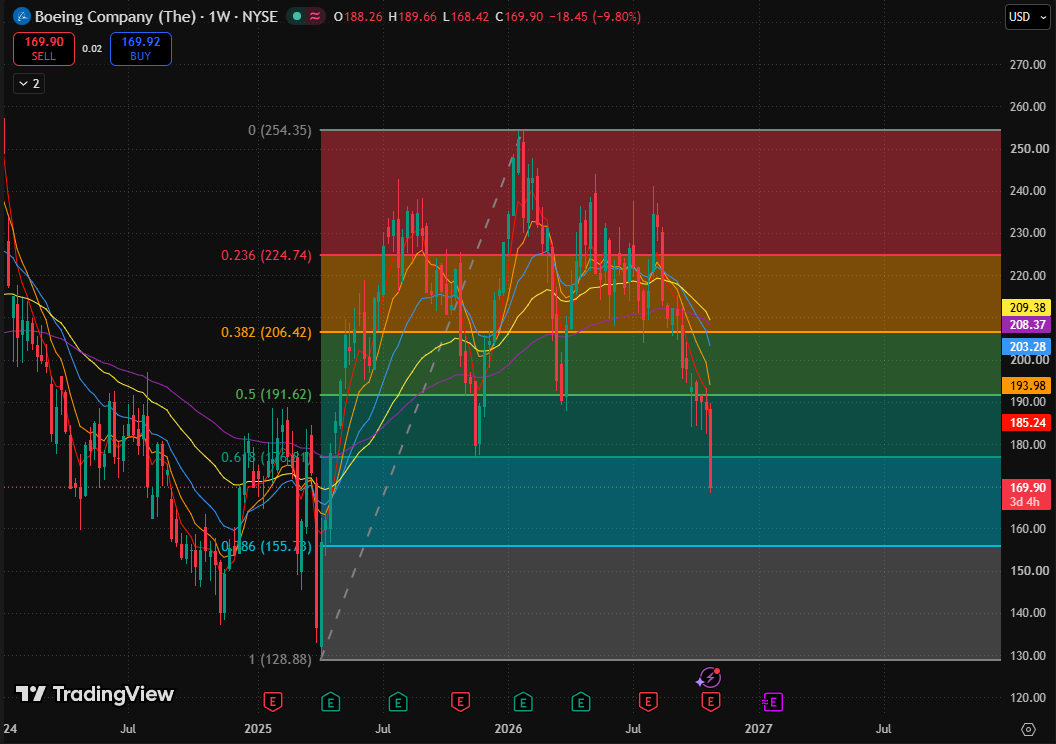
Boeing weekly chart, Source: TradingView
From a moving average perspective, short- and medium-term moving averages are pressing down above the price in sequence, showing layer-by-layer accumulation of rebound resistance; the 80-day exponential moving average and 160-day exponential moving average stand at approximately $209.38 and $208.37, respectively, and long-term moving averages have also weakened, though they do not yet form a strict five-line bearish alignment.
In terms of upside potential, the stock price needs to firmly reclaim $176.81 to have an opportunity to transition into post-breakdown recovery. Resistance above is first seen in the $185.24–$193.98 zone, where short-term moving averages and the previously lost 50% midpoint are concentrated, forming a resistance band that any rebound recovery must re-digest.
If the stock continues to break below this week's low, the assessment of a continued decline will be further reinforced. At that point, the 0.786 retracement area ($155.78) below will face a more direct test. Even if a rebound occurs, as long as it remains suppressed by short-term moving averages, it can only be viewed as a corrective recovery within a downtrend and cannot be used to confirm a trend reversal.
This content was translated using AI and reviewed for clarity. It is for informational purposes only.
Recommended Articles











Comments (0)
Click the $ button, enter the symbol, and select to link a stock, ETF, or other ticker.