


Microsoft Stock Price Forecast: MSFT Rebounds Over 50% From June Low, Earnings Beat May Push It Toward Record $555 High



AI Podcast


Microsoft is scheduled to report its fiscal first-quarter 2027 financial results after the market close on October 28, US Eastern Time. Analysts project revenue of approximately $90.6 billion, up 17% year-over-year, and adjusted earnings per share of $4.72. Azure cloud performance and artificial intelligence demand remain the primary growth catalysts, alongside potential margin pressures from capital expenditures exceeding $50 billion. Technically, the stock maintains a medium-term bullish structure above its moving averages, with immediate resistance near the $540–$545 zone and support resting at $527–$530 ahead of the earnings release.
TradingKey - Microsoft (MSFT) will report its fiscal first-quarter 2027 financial results after the market close on October 28, US Eastern Time. As its stock price reclaims $530 and approaches its all-time high, this earnings report could determine whether Microsoft can sustain its rally driven by Azure and artificial intelligence demand.
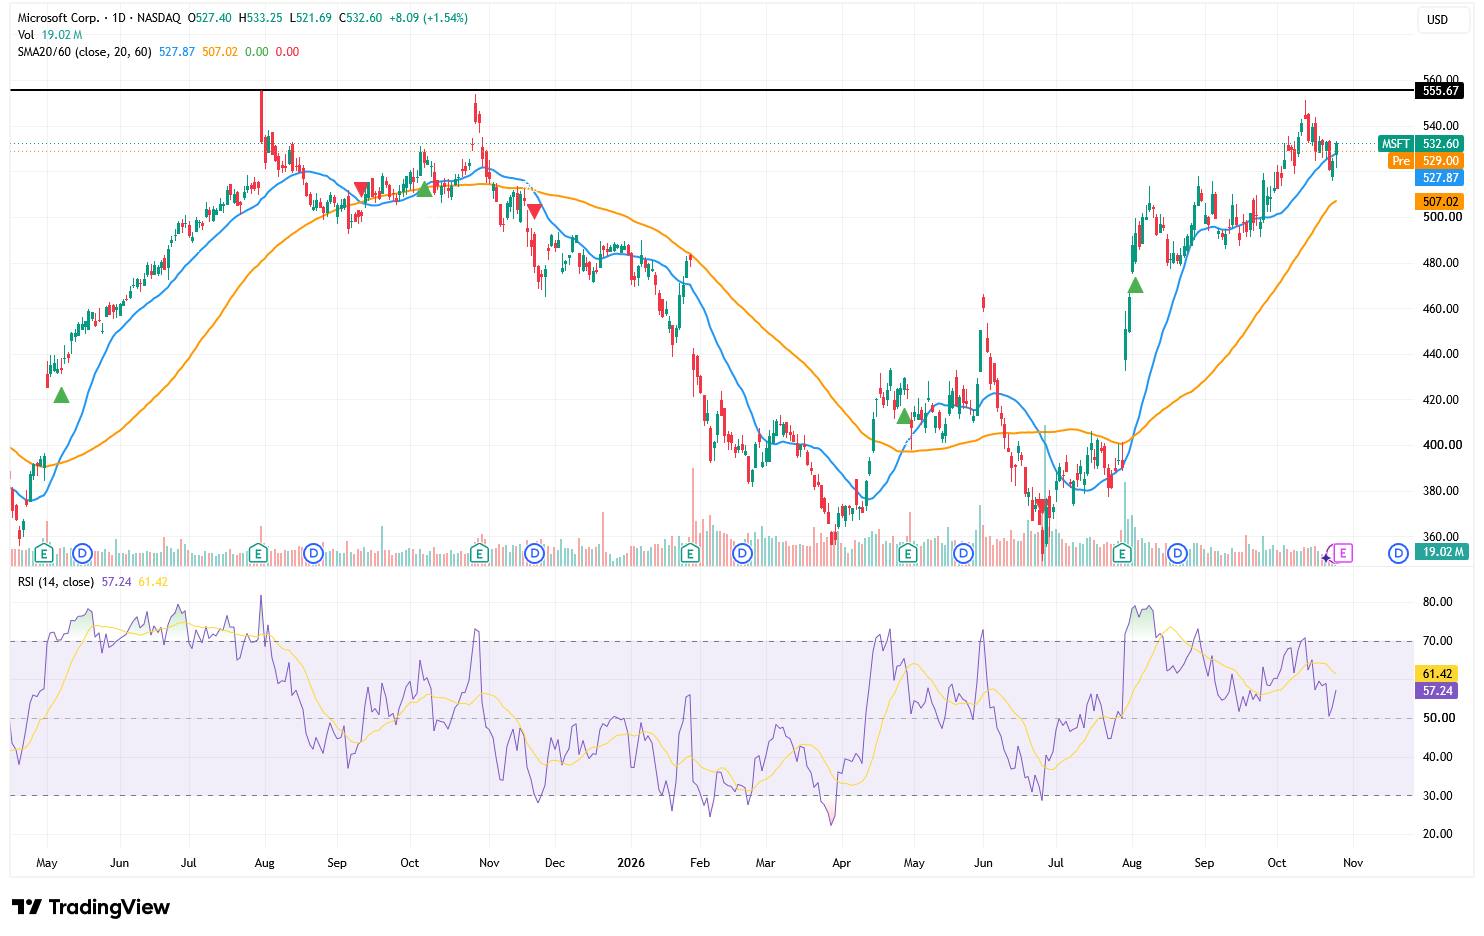
As of October 26, Microsoft's stock price closed at $532.60, up 1.54% on the day. Compared with the low of $349.20 hit on June 25, the stock has rebounded by approximately 52.5% cumulatively, and is currently only about 4% away from its all-time high near $555. This means that the market has already priced in quite optimistic growth expectations in advance.
The market expects Microsoft's first-quarter fiscal revenue to be approximately $90.6 billion, up nearly 17% year-over-year, with adjusted earnings per share expected at around $4.72, up from $4.13 in the same period last year. Microsoft previously provided revenue guidance of $89.85 billion to $90.95 billion, meaning market consensus is already near the upper end of the company's forecast range, so simply meeting guidance may not serve as a significant upside catalyst.
Azure remains the most critical metric in this earnings report. Microsoft expects Azure revenue to grow 44% to 45% on a constant-currency basis in the first fiscal quarter, accelerating from around 43% in the previous quarter. If actual growth surpasses the top end of the guidance while management confirms that customer demand continues to outstrip available computing power, the market will have greater reason to believe that Microsoft's cloud business remains in an acceleration phase, rather than relying on price adjustments or short-term contract recognition to sustain growth.
However, whether Microsoft's stock price can break through its all-time high depends not only on revenue growth but also on whether AI infrastructure costs begin to erode cash flow and profit margins. The company expects first-quarter capital expenditures to exceed $50 billion, with capex for calendar year 2026 reaching around $175 billion. Although Microsoft still expects to maintain positive free cash flow in fiscal 2027 and limit the decline in full-year operating margin to within one percentage point, the market will closely monitor depreciation pressure stemming from investments in data centers, GPUs, and networking equipment.
Source: TradingView
From a technical perspective, the stock price has reclaimed its 20-day moving average of $527.87 and continues to trade above its 60-day moving average of $507.02. With the 20-day moving average above the 60-day moving average and both trending upward, the medium-term bullish structure remains intact.
In the short term, immediate resistance to watch is in the $540–$545 zone. If the earnings report drives the stock to break above this area on heavy volume and gain confirmation from the daily close, the next target will point toward the record high of $555, representing about 4% upside from current prices. A further breakthrough above $555 could open up new upside room.
The RSI currently stands at around 57.24. Although it is below its smoothed signal line of 61.42, it remains above the 50 bullish-bearish divide, indicating that upside momentum has cooled somewhat but has not turned bearish. To the downside, initial support lies at $527–$530; a break below this could test $515, with core support located near the 60-day moving average around $507.
This content was translated using AI and reviewed for clarity. It is for informational purposes only.
Recommended Articles











Comments (0)
Click the $ button, enter the symbol, and select to link a stock, ETF, or other ticker.