


Meta Stock Forecast: META Tests $629 Support After a $37.5 Billion Stock Sale at $625



AI Podcast


Meta Platforms announced a multi-billion-dollar equity financing plan, including a $25 billion common stock sale and $12.5 billion in preferred stock, to fund expanding artificial intelligence capital expenditures. Despite robust third-quarter revenue growth, surging capex resulted in negative free cash flow, prompting the capital raise and driving credit default swaps wider. The offering and dilution concerns have triggered selling pressure, pushing the stock below key technical support levels. While the short-term trend remains bearish with an oversold RSI, major analysts maintain consensus price targets significantly above current trading levels.

TradingKey - Meta Platforms, Inc. (NASDAQ: META) fell 1.88% to $630.56 on Monday, October 26, after announcing a stock sale to help fund its artificial intelligence (AI) efforts. The company priced the stock sale after the close at $625, slightly below where it finished the day.
The stock is down about 9.6% since it reported earnings on October 21 and is down about 19% since hitting a 52-week high of $779.82. Early pre-market quotes for the stock on Tuesday were in the $628.50 range.
What Meta Is Selling
In a filing with the Securities and Exchange Commission, Meta sold approximately 40 million of its Class A common stock for $625 per share, for a total of $25 billion. The stock sale is through forward agreements, which means Meta agrees to sell the shares now, but won’t receive the net proceeds of $24.9 billion until the agreements settle on or before November 19, 2027.
The sale also includes $12.5 billion of mandatory convertible preferred stock, which have a 6.5% annual dividend, and will be converted to common stock on or about August 15, 2029. The preferred stock conversion implies an effective share price of $625 to about $734 per share.
Beyond that, the company will implement an at-the-market program to sell up to $60 billion of its newly created non-voting Class C shares beginning in the first quarter of 2027. The two plans, if completed, would bring in almost $100 billion. Nvidia, Advanced Micro Devices and Broadcom have indicated interest in buying up to $5 billion of the common stock, though those indicate intentions are not legally binding.
Why Meta Needs the Cash
Revenue for the third quarter rose 26% to $64.6 billion, better than the $63.3 billion analysts expected, but capital expenditures grew faster. Capital expenditures (capex) for the quarter grew to $34.91 billion, or about 54% of the company's revenue, compared with an operating cash flow of $32.79 billion. That left free cash flow for the quarter at negative $2.12 billion, Meta's first negative free cash flow quarter since 2012.
Meta increased its capex guide for 2026 to $135 billion to $145 billion. As of the end of the third quarter, cash of $82.45 billion roughly offset long-term debt of $80.92 billion.
Credit Markets Pushed Back First
According to Reuters, on October 22nd, Meta's five-year credit default swaps (CDS), which pay out if the issuer defaults, widened to 114.79 basis points. This means Meta's debt would cost about 1.15% to insure. The stock fell 6.98% to $648.85 that day.
This is why Meta is turning to stock. In October 2025, Meta sold $30 billion of bonds, and a Blue Owl venture raised more than $27 billion of debt for its Hyperion data center. Meta claims its credit ratings still permit efficient borrowing, but cites equity as a complementary source of capital.
How Much Dilution
Dilution occurs when new shares get issued. With forward sales, I estimate about 1.6% dilution, assuming the rest of the 2.56B shares outstanding remain. The preferred stock conversion would add about 20 million. A full Class C program at the current price would add about 95 million shares. Combined, about 6% dilution is possible in the coming years.
Earnings are expected to be less clear with Meta recording the changes in the fair value of the forward agreements in the income statement until settlement.
Analysts Still See Upside
The report was bullish for the stock, leading Susquehanna, Cantor, Rosenblatt and KeyBanc to increase their price targets to $850, $860, $900 and $905, respectively from their prior levels. TD Cowen was the lone bear, lowering its price target to $830 from $865. Consensus price targets are in the $833 to $847 range, over 30% above Monday's close.
Despite the bullish targets and interest from Nvidia, AMD and Broadcom, selling pressure has dominated the stock.
Meta Technical Analysis: 4-Hour Close Below $629 Could Open $603
Selling pressure can be seen on the 4-hour chart. META broke below the rising trendline that had been supporting it since August, and the lower of the higher lows. It is now sitting at $629.33, which is the 61.8% Fibonacci retracement level. At that level, the stock has retraced 61.8% of its prior rally, which is a level buyers typically defend. The stock is also currently trading below both of its moving averages, which track the average price over a given time period, and are therefore bearish. The stock’s $625 offering price is sitting just under the support level.
RSI, which is a momentum oscillator that ranges from 0 to 100, is at the 26 level, which is oversold, and indicates that the recent decline has been rather swift.
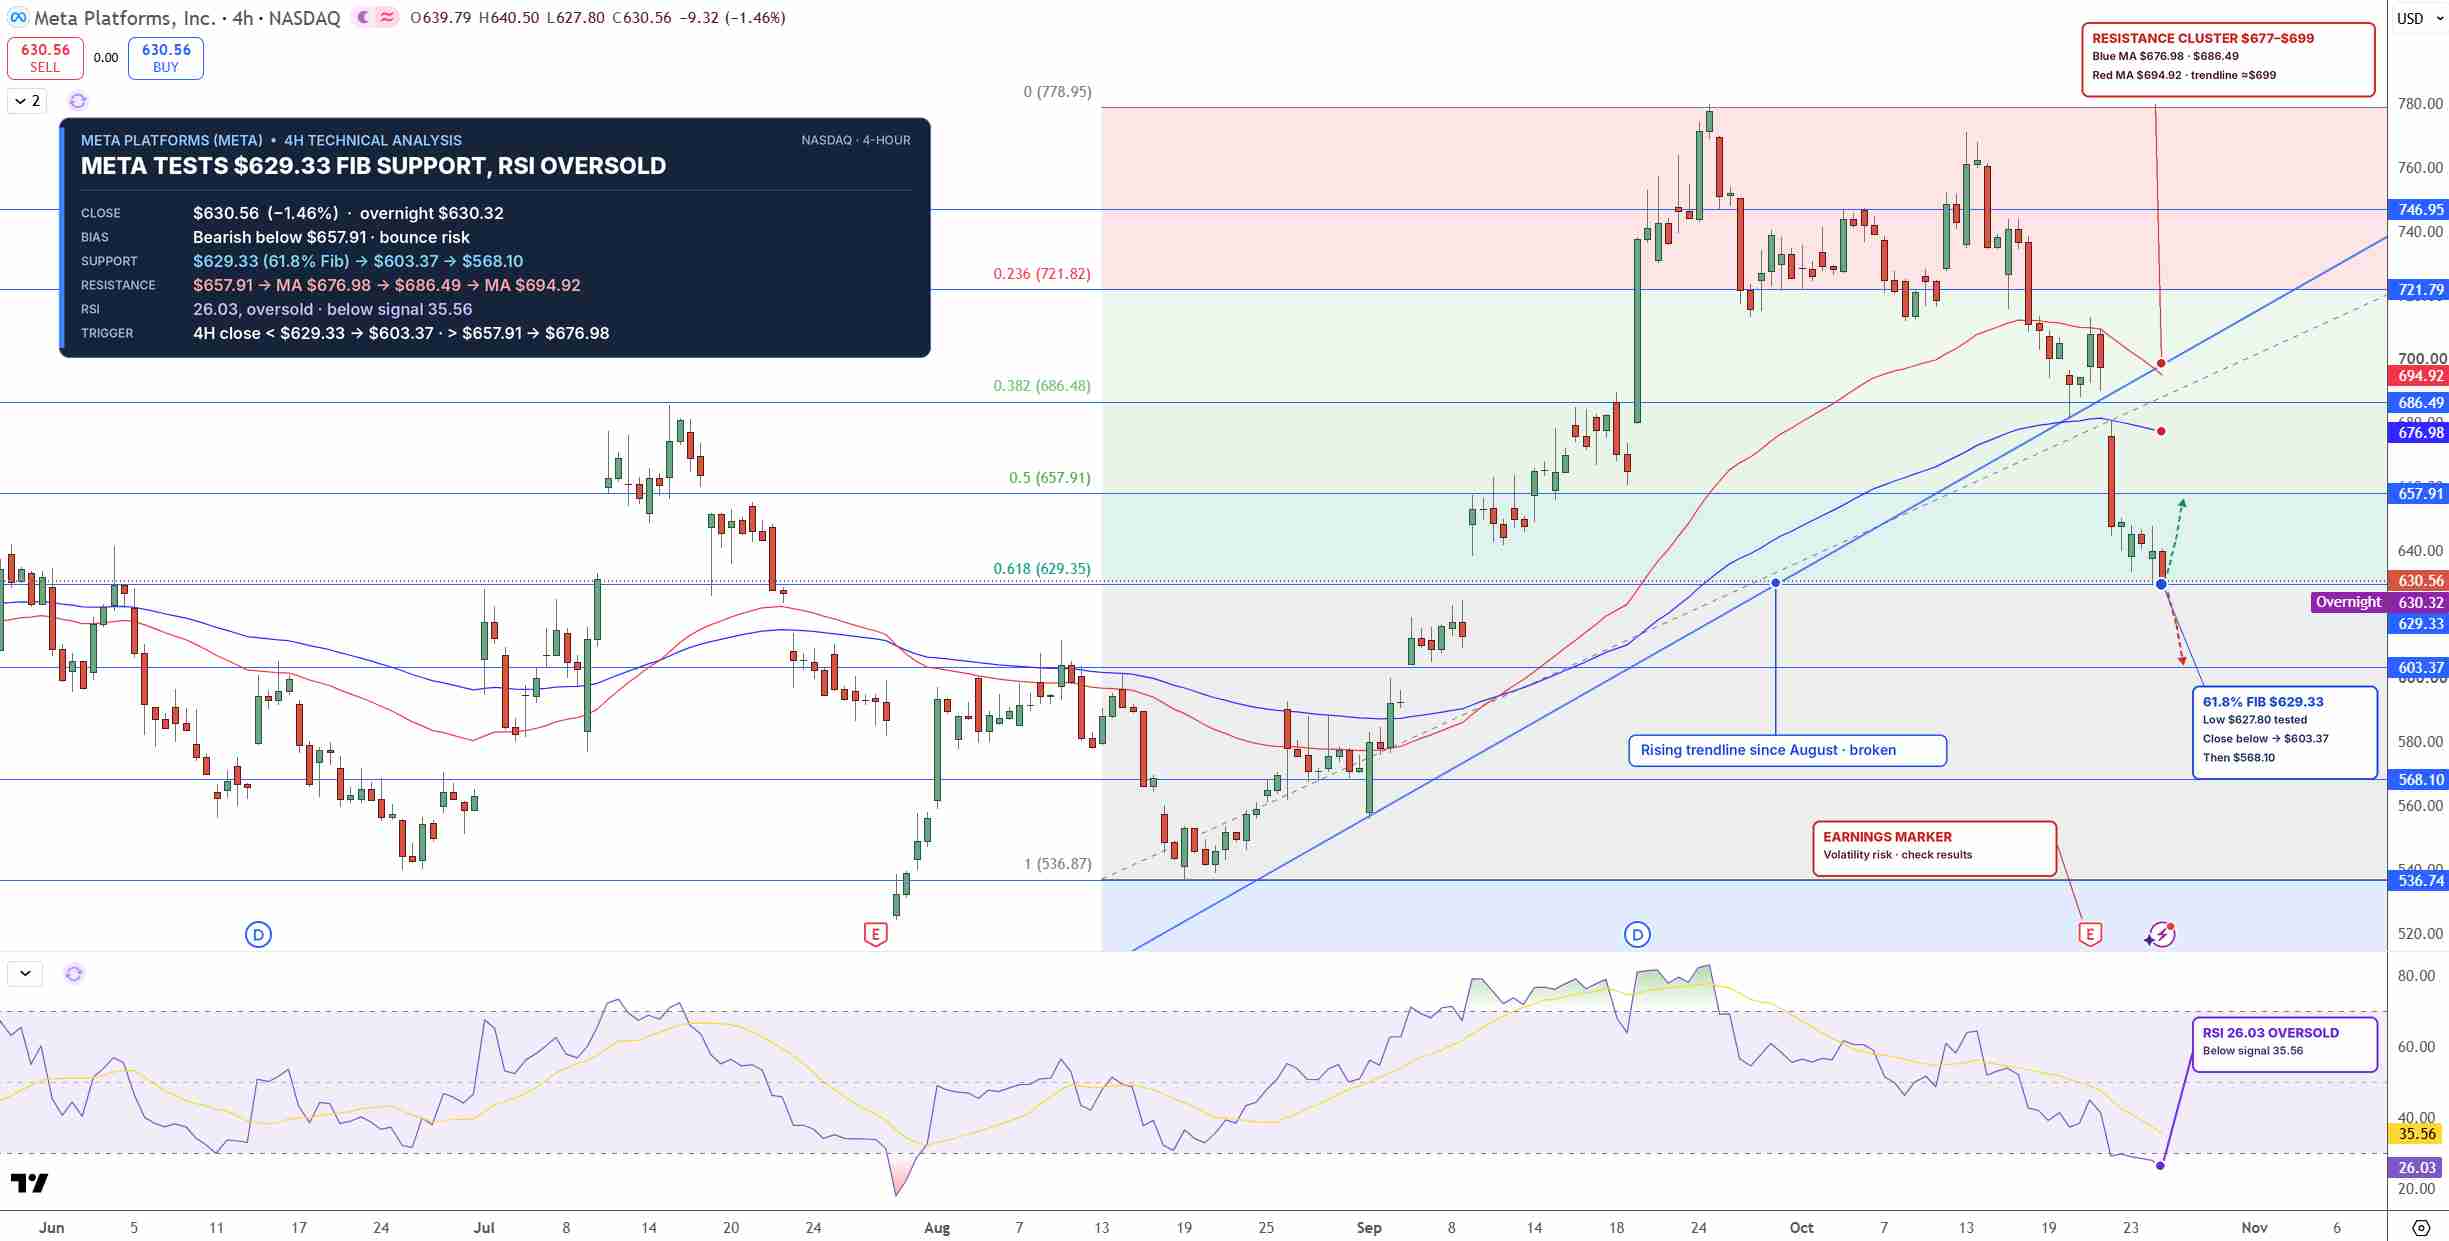
META Price Chart - Source: Tradingview
A 4-hour close below $629.33 would open $603.37, and then $568.10. The first line in the rope to the upside is at $657.91. If META trades above that level, then $676.98, where the 50 moving average is, would be the next target. Until META is trading above $657.91, I’m looking for the trend to be bearish. Oversold conditions could be temporary bullish conditions first.
Key Levels
- Last close: $630.56, down 1.88% October 26
- Support: $629.33, $603.37, $568.10
- Resistance: $657.91, $676.98, $694.92
- RSI: 26, oversold
- Bullish trigger: 4-hour close above $657.91
- Bearish trigger: 4-hour close below $629.33
FAQs
Why did Meta stock fall on October 26?
Meta fell 1.88% to $630.56 after launching a stock sale to fund its AI spending. It priced $25 billion of common stock at $625 and $12.5 billion of mandatory convertible preferred.
What is the Meta stock forecast now?
The bias is bearish below $657.91 on the 4-hour chart. A 4-hour close below $629.33 targets $603.37 and $568.10, while a recovery above $657.91 opens $676.98.
Bottom Line
Meta's ad business is fast growing but spending on AI means it will need to raise money repeatedly in the short-term. The $625 offering price sits under key support at $629.33. I see key support at $629.33 as very important. In the short-term, a 4-hour close below that level opens $603.37, while a close above $657.91 would ease the downward pressure.
Recommended Articles










Comments (0)
Click the $ button, enter the symbol, and select to link a stock, ETF, or other ticker.