


Amazon Stock Price Forecast: Morgan Stanley Says Market Has Yet to Fully Reflect AWS Growth Potential and Profitability, Shares May Start a New Rally



AI Podcast


Morgan Stanley designated Amazon as a "Top Pick" and raised its price target to $350, citing underappreciated AWS growth and profitability. Driven by increased GPU deployment and Bedrock's role in enterprise generative AI adoption, AWS revenue and margin forecasts were upgraded, with operating margins projected at 44% by 2028. Risks include capital expenditures outpacing revenue recovery and potential free cash flow lag. Technically, the stock surged over 5% to clear $260.69, forming a bullish moving average alignment. Sustained upside requires breaking resistance between $263 and $265.75, while failure risks sliding back into the consolidation range.

TradingKey - Morgan Stanley named Amazon (AMZN) a "Top Pick," raising its price target from $335 to $350. The bank believes the market has not yet fully priced in AWS's growth potential and profitability.
Based on higher GPU deployment expectations, Morgan Stanley raised its AWS revenue growth forecasts for 2027 and 2028 from 41% and 37% to 47% and 42%, respectively. The additional computing capacity is expected to help AWS meet more customer demand and support revenue growth.
However, for the stock price, the value of expansion also depends on whether revenue can cover depreciation and operating costs. Morgan Stanley estimates that AWS's operating margin will reach 44% in 2028, about 2 percentage points higher than its previous forecast, contributing roughly 67% of Amazon's operating profit. If revenue and margins improve in tandem, AWS could drive upward revisions to the group's earnings expectations, while also helping ease investor concerns over returns on AI investments.
Morgan Stanley also believes Bedrock's role in corporate adoption of generative AI is undervalued. The platform offers a variety of models and AI application development capabilities, helping enterprises build and run applications.
If enterprise customers shift from experimentation to ongoing deployment, AWS stands to gain more paid API calls and demand for related cloud services. For investors, this impacts not only short-term revenue but also their assessment of AWS's growth sustainability, which could in turn raise the valuation multiple they are willing to assign to Amazon.
The risk lies in computing capital expenditures preceding revenue recovery, while earnings growth may not synchronously translate into improved free cash flow. If demand materializes slower than expected or depreciation pressure exceeds expectations, potential valuation expansion could be constrained.
Technically, Amazon's stock rose over 5% intraday, reclaiming all five exponential moving averages and clearing the key level of $260.69. The intraday rally improved its short-term structure, representing a strong recovery within the consolidation range as it challenges the October rebound high once again.
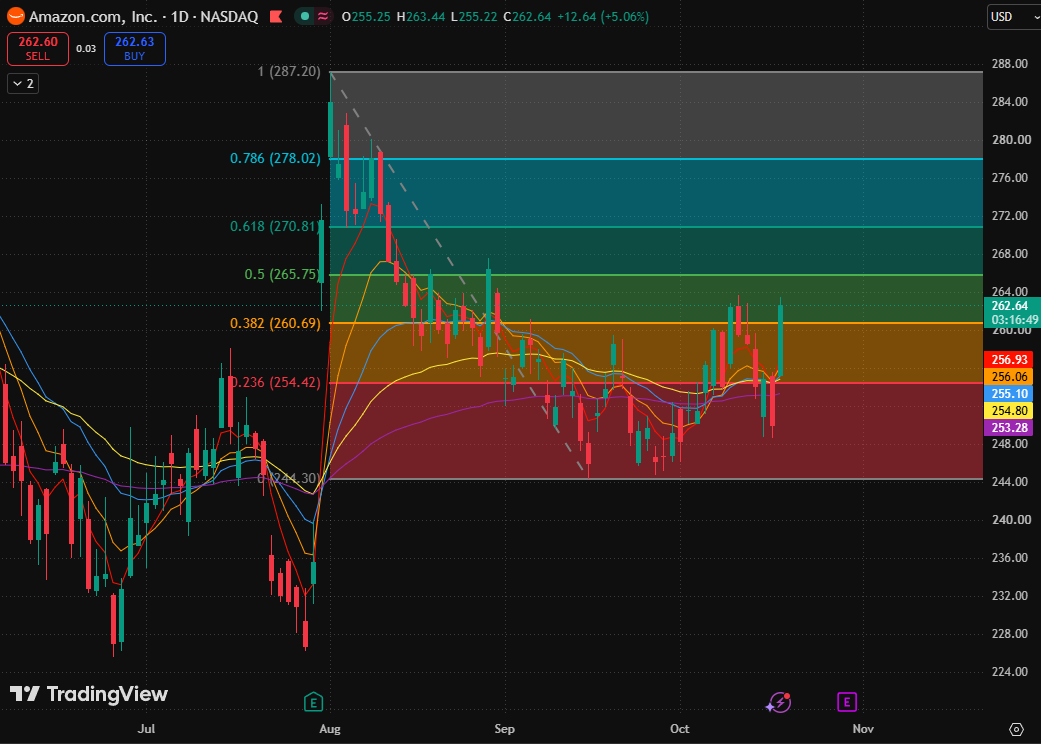
Amazon stock price chart, Source: TradingView
Regarding moving averages, the 5-day, 10-day, and 20-day exponential moving averages stand at $256.99, $256.09, and $255.12, respectively, while the 80-day and 160-day exponential moving averages sit at $254.80 and $253.28, forming a bullish alignment. However, the five moving averages remain concentrated within a narrow range and have not fully fanned out upward, reflecting that the short-term recovery is outpacing medium-to-long-term trend confirmation.
Current upside resistance is concentrated between $263 and $265.75, formed by recent rebound highs and the 0.5 Fibonacci retracement level; a valid break above this zone would further challenge the 0.618 Fibonacci retracement level ($270.81).
On the downside, caution is needed regarding another failed attempt to breach the upper boundary of the consolidation range, followed by a slide back below the recently reclaimed level, forming a secondary rejection at resistance and reapplying pullback pressure onto the dense moving average cluster. If this support band is also lost, the current assessment of a "strong recovery" will be significantly weakened, and the trend could shift back toward the lower end of the range.
This content was translated using AI and reviewed for clarity. It is for informational purposes only.
Recommended Articles












Comments (0)
Click the $ button, enter the symbol, and select to link a stock, ETF, or other ticker.