


SpaceX Stock Price Forecast: Q3 Earnings Ahead, Can Stock Hold $140?



AI Podcast


On October 19 ET, SpaceX shares closed at $146.03 amid a monthly decline exceeding 10%. Ahead of Q3 2026 earnings on Tuesday (October 20), Wall Street projects revenue of $12.89 billion and EPS of $0.14 to $0.23, potentially marking its first positive quarterly EPS post-IPO. Key focuses include Starlink's profitability and subscriber growth alongside AI revenue and capital expenditure pressures. Technically, the stock is under bearish pressure below the 20-day moving average, holding a critical support level at $140. A break below $130 risks further downside, while holding $140 could trigger a short-term rebound toward $149–$152.

TradingKey - On October 19 ET, SpaceX (SPCX) shares fell 1.74% last Friday, closing at $146.03, with its cumulative decline this month exceeding 10%. Against the backdrop of ongoing pressure on AI-related stocks recently, SpaceX will report its Q3 2026 financial results after the market close on Tuesday (October 20), which will significantly impact its future stock price performance.
SpaceX Earnings Preview: Focus on Return to Profitability, Starlink and AI Revenue
In terms of market expectations, Wall Street currently forecasts SpaceX's third-quarter revenue to reach approximately $12.89 billion, up about 65% year-over-year, with earnings per share expected at around $0.14 and some institutional forecasts reaching as high as $0.23. By comparison, the company reported second-quarter revenue of $7.81 billion, up 92% year-over-year, with a loss per share of $0.09. Therefore, if market expectations are met this quarter, SpaceX will post its first positive quarterly EPS since going public.
The first key focus of this earnings report is the Starlink business. The market expects third-quarter Starlink and Connectivity-related revenue to be approximately $4.7 billion to $4.8 billion, with the operating margin projected to rise further to around 37.5%. SpaceX's Starlink user base reached 12 million in the second quarter, with Connectivity revenue at $4.29 billion; thus, net subscriber additions, ARPU, and growth among enterprise and government clients this quarter will directly impact the market's valuation of Starlink's future cash flows. If both revenue and profit margins beat expectations, it could provide positive support for the stock price; if subscriber growth slows, it may weigh on the market's assessment of the sustainability of growth in the Connectivity business.
The second key focus is the AI business and capital expenditures. The market currently expects SpaceX's third-quarter AI-related revenue to reach approximately $6.47 billion, making it a significant source of revenue growth; however, the company also needs to continuously invest in data centers, GPUs, and power infrastructure. Market estimates indicate that cash burn could reach approximately $10.8 billion this quarter. A primary concern behind the recent decline in the AI sector is whether high capital expenditures can translate into sufficient earnings growth. Consequently, if AI revenue growth exceeds expectations while capital expenditures and cash burn remain controlled, the stock price could find support; conversely, even if revenue beats expectations, if the scale of investment continues to expand significantly, the market may remain focused on free cash flow pressures.
For investors, close attention should also be paid to management updates on post-Flight 14 launch plans for Starship, Starlink Mobile, and next-generation satellite deployments. SpaceX recently acquired approximately $8 billion in 800MHz wireless spectrum while obtaining FCC approval to deploy up to 15,000 next-generation Starlink Mobile satellites. These projects indicate that future capital requirements are likely to remain at a high level.
SPCX Stock Price Technical Analysis
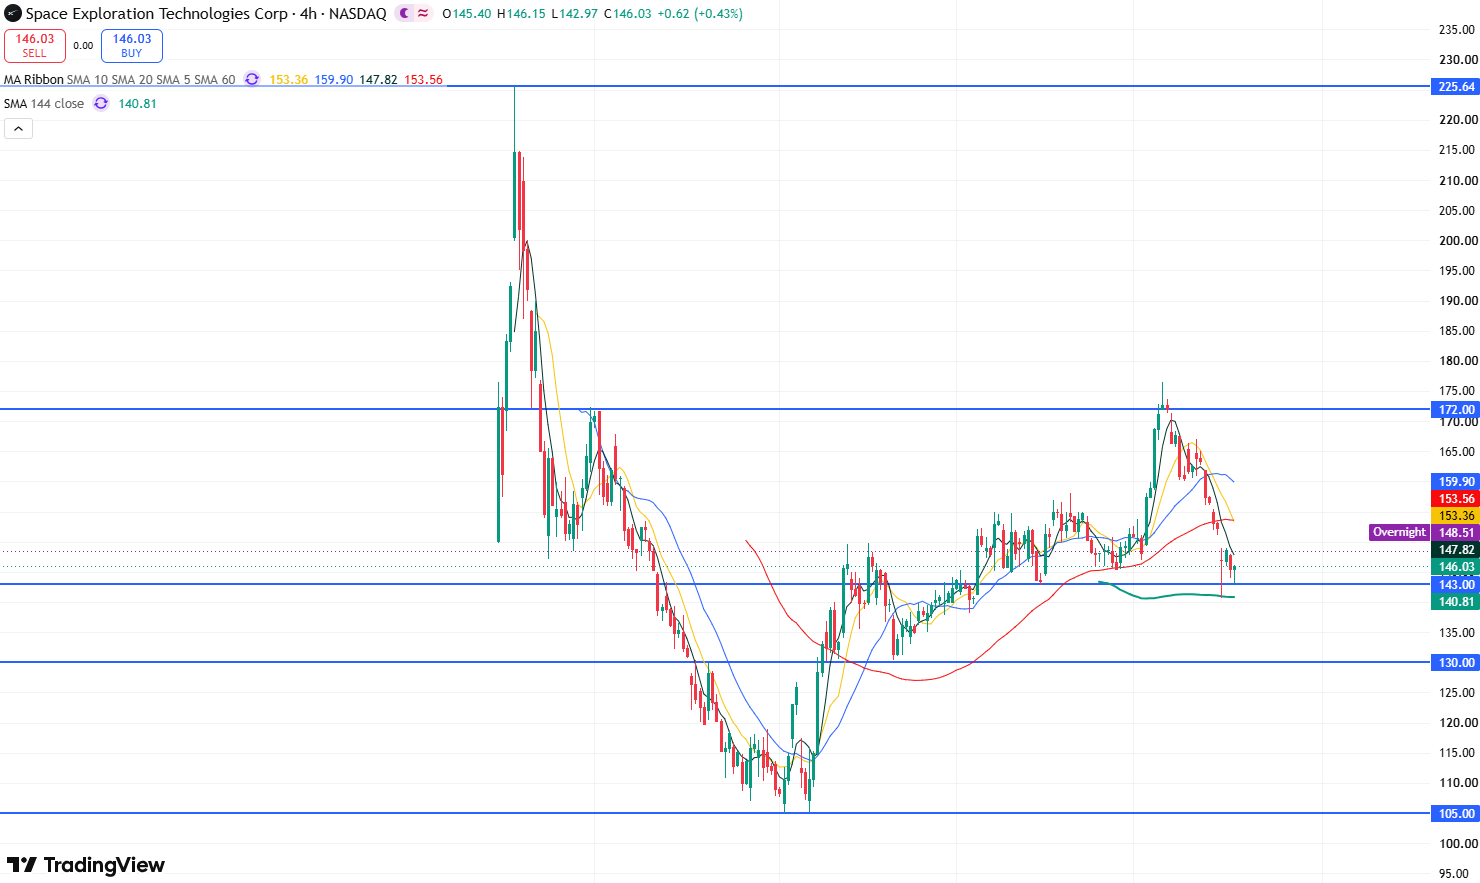
SPCX stock price daily chart, Source: TradingView
Looking at the daily chart of SPCX's stock price, the stock has been steadily pulling back since reaching a periodic high of $176.42 on October 6. As of October 16, it closed at $146.03, falling below the 20-day moving average of around $155.24, which indicates that market sentiment is dominated by bears. However, over the past two trading days, the stock price tested down toward $140 without breaking below it, suggesting a degree of support at this level. Meanwhile, this level sits above the 60-day moving average, which could form a confluence of support, potentially driving a short-term rebound in the stock price.
Currently, if the stock price breaks below the key support level of $140, it may pull back further toward $130 in the short term. If this level fails to hold, the stock price could decline toward $105.
Conversely, if the stock price holds firmly above $140, it is expected to rebound and fill the recent gap of $149-$152. Above that, the next level would be $156, and further gains could lead to a retest of resistance near $167.
This content was translated using AI and reviewed for clarity. It is for informational purposes only.
Recommended Articles












Comments (0)
Click the $ button, enter the symbol, and select to link a stock, ETF, or other ticker.