


Micron Stock Price Forecast: Four-Day Slide Retreats to $950 Critical Level, Shares Could Fall Over 20% Further



AI Podcast


Micron Technology shares dropped for four consecutive sessions, testing the $950 support level amid a potential 20% downside risk. Key catalysts include concerns over CXMT’s 4F² DRAM technology breakthrough threatening traditional memory market share, increased fiscal 2027 capital expenditure exceeding $20 billion weighing on short-term cash flow, and broader macroeconomic pressures from high U.S. Treasury yields triggering tech sector outflows. If the critical $950 Fibonacci retracement level fails to hold, the stock risks a deeper decline toward the $740–$800 range.

TradingKey - Micron falls for four straight sessions to hold $950, with risk of further decline exceeding 20%.
On October 13 Eastern Time, after Micron Technology (MU) lost the $1,000 mark following three consecutive drops, its stock fell nearly 3% further in today's pre-market session, sliding to a low of $950 and trading around $960.2.
The core catalyst behind this continuous pullback in Micron's stock price is the 4F² DRAM technology breakthrough by China's ChangXin Memory Technologies (CXMT). Although Micron boasts a strong moat in AI high-bandwidth memory (HBM3e/HBM4), the market is concerned that CXMT's capacity expansion and mass-production progress in commodity DRAM and server memory could over the long term erode the market share and pricing power of the three traditional memory giants, including Micron and SK Hynix (SKHY).
However, the continuous pullback in Micron's stock price since October is not caused by a single event. Although Micron reported strong Q4 financial results in late September and management gave a solid Q1 outlook, the company announced a significant increase in fiscal year 2027 Capex to over $20 billion to consolidate its leadership in HBM3e/HBM4. As market sentiment turned cautious, the pressure of high Capex on short-term free cash flow provided a pretext for bears to drive prices down.
In addition, there is an unignorable macroeconomic factor. Affected by stubbornly high U.S. Treasury yields and risk-off sentiment across global tech stocks, capital saw wave-like outflows from high-Beta semiconductor giants in early October, with tech leaders such as Nvidia (NVDA) and SpaceX (SPCX) all experiencing notable pullbacks.
As Micron's stock price fell below $1,000, the market's primary focus shifted to $950, which represents the starting point of the August–September bullish rally overlaid with the 0.382 Fibonacci retracement support level. If $950 can hold on declining volume, this drop can still be characterized as a high-level pullback; if broken, the stock may test the $780–$800 range for a deep retest, or even fall to the July low of $740, representing more than 20% downside risk from current levels.
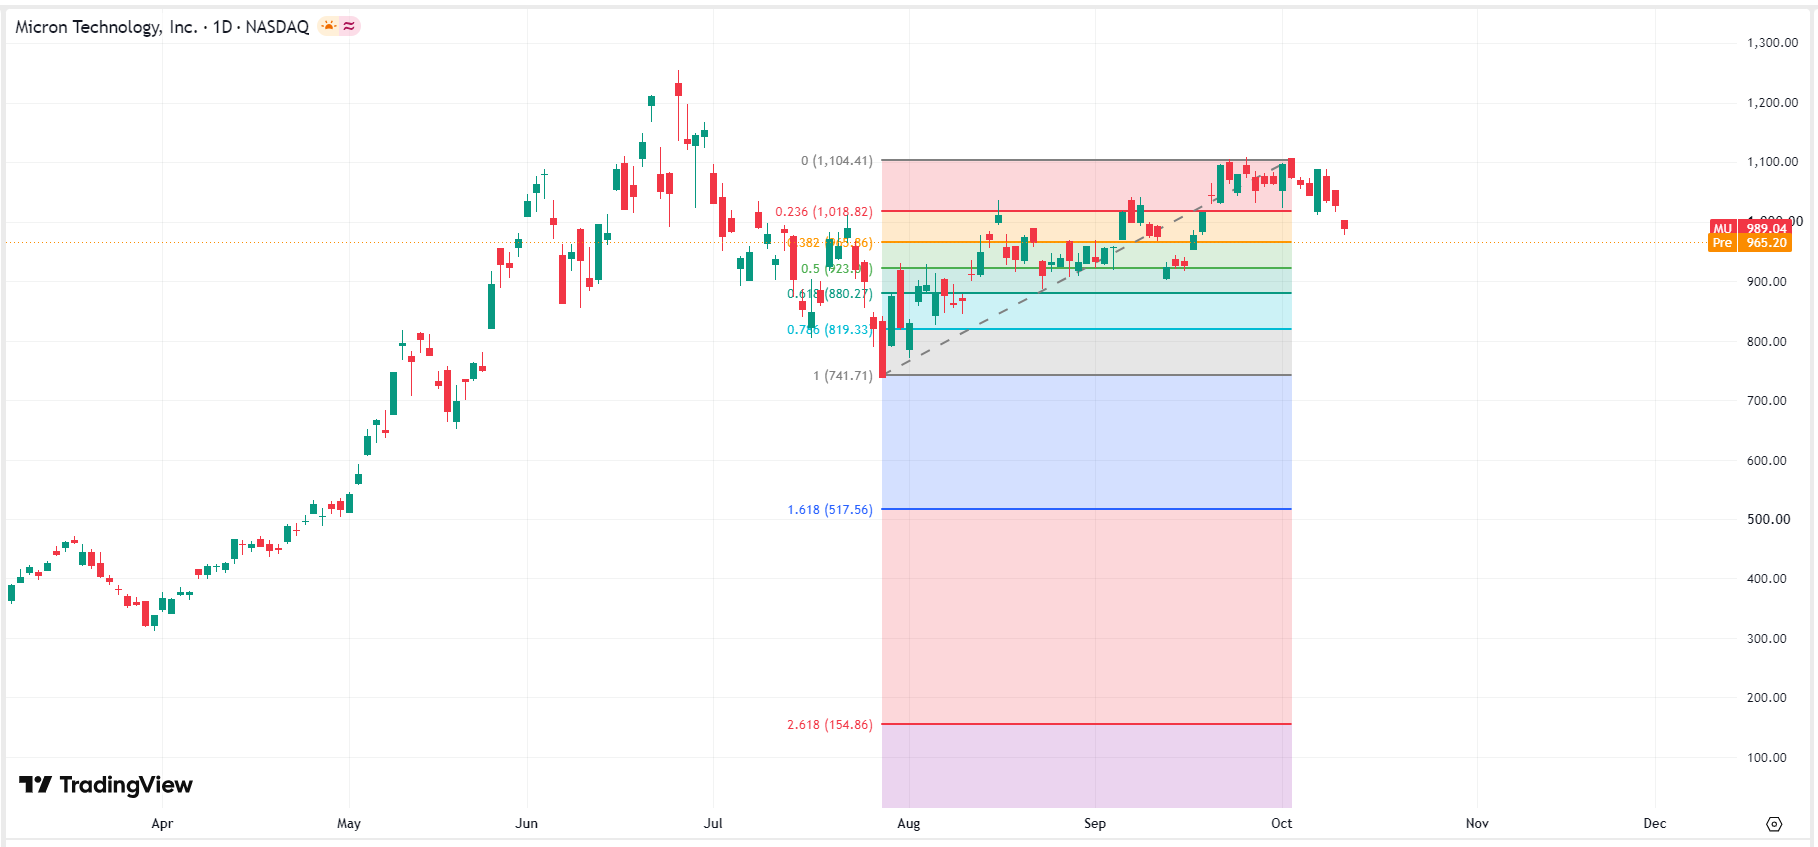 Micron stock chart. Source: TradingView
This content was translated using AI and reviewed for clarity. It is for informational purposes only.
Recommended Articles












Comments (0)
Click the $ button, enter the symbol, and select to link a stock, ETF, or other ticker.