


SanDisk Stock Price Prediction: Surges 11% on Heavy Volume to Approach $1,800, Can SNDK Unlock Further Upside?



AI Podcast


On September 18, memory chip stocks surged, led by SanDisk’s 10.99% jump to $1,791.82, driven by AI data center demand and heavy short-term call options trading totaling roughly $93 million to $96 million. While market makers hedging positions may have amplified the rally, speculative options activity carries high time-decay risks. Technically, SanDisk reclaimed key moving averages, with an RSI of 61.43 indicating strong momentum. The critical resistance zone lies between $1,800 and $1,830.90, where a breakout could target $2,000, while failure to breach resistance risks a pullback to crucial support at $1,578–$1,591.

TradingKey - Massive short-term options trading drove strength in the memory chip sector, with SanDisk (SNDK) emerging as the standout performer. On September 18, SanDisk surged 10.99% on heavy volume to close at $1,791.82, hitting an intraday high of $1,797, just shy of the $1,800 round-number mark.
Beyond expectations of AI data center demand for memory products, unusually active call options trading also served as a key catalyst for this rally. Intraday capital heavily bought short-term options in SanDisk, Micron Technology, Intel, and Marvell, with total premiums amounting to approximately $93 million to $96 million across different calculation criteria.
CNBC host Jim Cramer noticed these trades and posted on social media, stating, "Leopold seems to be back," referring to fund manager Leopold Aschenbrenner, who is known for placing high-leverage bets on AI and semiconductor stocks. However, no regulatory filings currently confirm that he was the buyer of these options, and the claims remain pure market speculation.
$41 Million in Call Options Pours Into SanDisk
Among the contracts expiring on October 2, SanDisk call options with a $1,600 strike price involved approximately 4,200 contracts with premiums totaling around $41 million, while Micron $1,000 calls saw roughly 10,000 contracts with about $44 million committed. Large call trades were also observed in Intel and Marvell, though their capital size was significantly smaller than that of the former two. Intraday data disclosed by Benzinga showed that SanDisk and Micron absorbed the vast majority of the premium.
At the time of the trades, SanDisk's share price was already above the $1,600 strike price, while Micron was hovering near $1,000. With less than two weeks left until expiration, these contracts were highly sensitive to fluctuations in the underlying stock while also facing rapid time decay. Such trades require the stock price to continue rising within a short window; otherwise, the value of the options could decline rapidly.
Heavy trading volume in call options can also provide a boost to the spot market. If market makers are net sellers of the options, they typically need to buy the underlying stock to hedge their risk. As the stock price rises and the option's delta increases, market makers may continue to add to their stock positions, thereby amplifying the short-term rally. However, trading volume data alone cannot determine whether these trades were directional buys, spread combinations, or closing transactions; therefore, unusual options activity cannot be taken as a direct signal that the stock price is bound to rise.
SanDisk Stock Price Technical Analysis
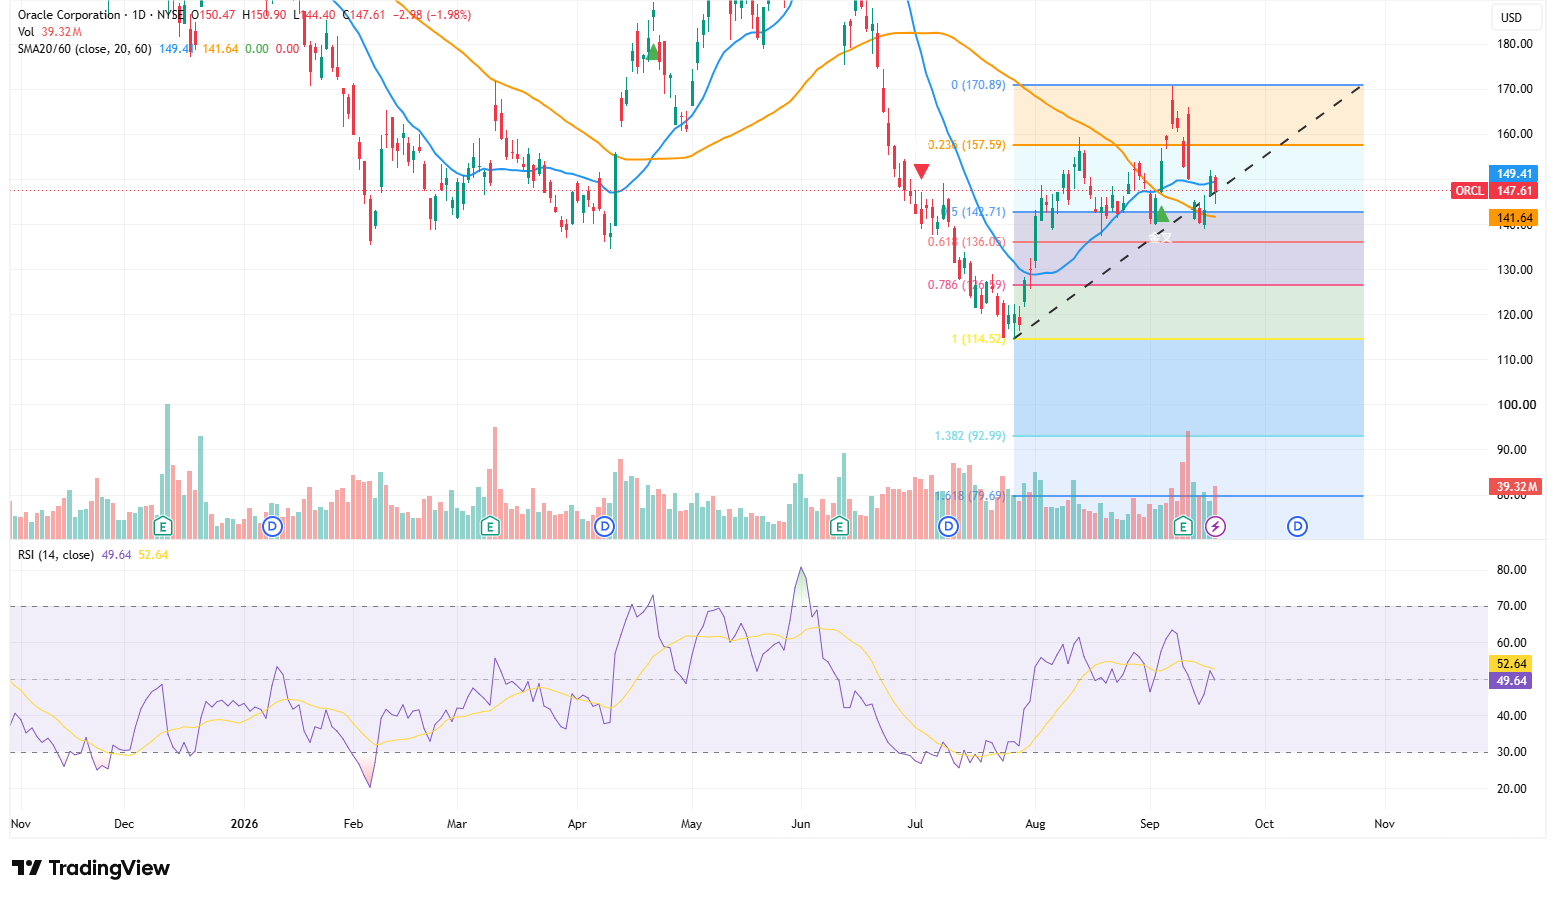
Source: TradingView
SanDisk shares surged 10.99% in a single day to close at $1,791.82, near the intraday high of $1,797, accompanied by a noticeable expansion in trading volume that points to strengthening buying power. The stock has reclaimed its 20-day moving average of $1,591.42 and 60-day moving average of $1,578.08, signaling a firming short-term trend.
Currently, the most critical resistance lies between $1,800 and $1,830.90, which coincides with both the neckline of an inverse head-and-shoulders pattern and the 0.618 Fibonacci level. If the daily chart holds above $1,831 on strong volume, the pattern breakout will be confirmed, with the next targets seen at $2,000 and $2,071.60, and further attention on the previous high of $2,348.66.
The RSI has risen to 61.43, remaining above the signal line of 54.52, indicating strong momentum while not yet overbought. However, if the stock fails to break above $1,831, it may experience a short-term pullback to $1,670.96; more crucial support sits in the moving average zone of $1,578–$1,591.
This content was translated using AI and reviewed for clarity. It is for informational purposes only.
Recommended Articles










Comments (0)
Click the $ button, enter the symbol, and select to link a stock, ETF, or other ticker.