


Trip.com Jumps Over 5% Pre-Market as Q2 Revenue Beats Estimates at $2.3 Billion, Led by International Business



AI Podcast


Trip.com Group reported Q2 2026 financial results on September 15 ET, with revenue and adjusted earnings beating expectations. Net revenue rose 6% year-over-year to RMB 15.7 billion, driven by international platform revenue surging over 50%. Excluding an anti-monopoly penalty, net income reached RMB 2.7 billion. Accommodation and packaged-tour segments saw steady growth, offset by a slight decline in transportation ticketing. While international expansion and inbound tourism momentum provide strong upside, potential risks include ongoing anti-monopoly rectifications and rising global travel costs impacting domestic and ticketing performance.

TradingKey - After the market close on September 15 ET, Trip.com Group (TCOM) reported its unaudited financial results for the second quarter of 2026. Both revenue and adjusted earnings per ADS exceeded market expectations, with international platform revenue surging over 50% year-over-year.
In U.S. pre-market trading on September 16, Trip.com's stock price rose over 5% at one point. As of press time, Trip.com was up about 4.36% to $40.96.
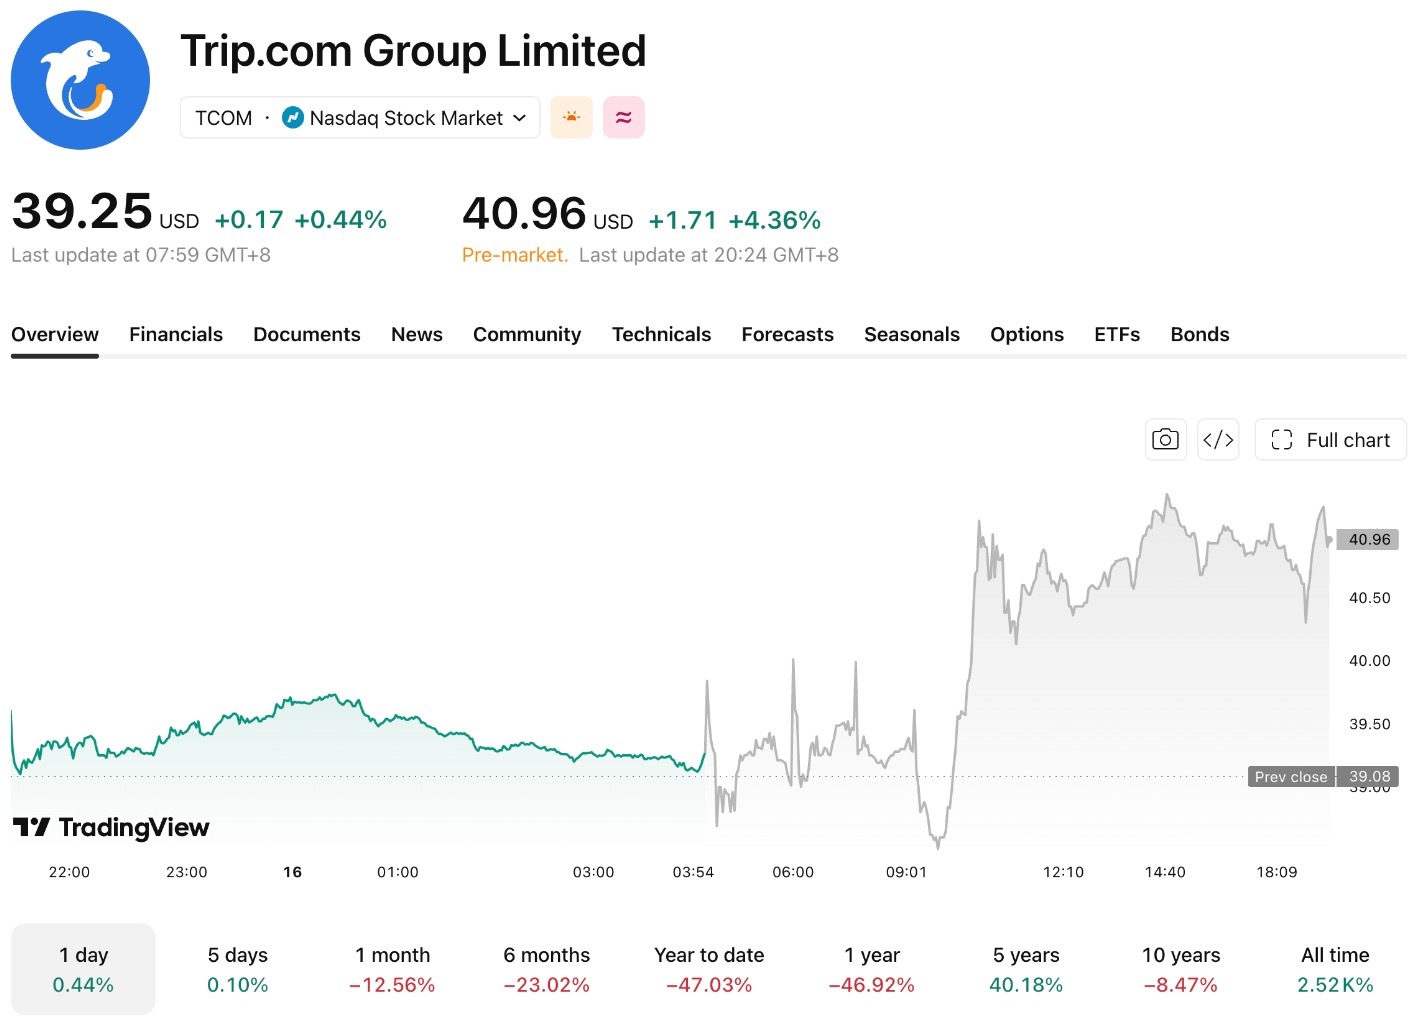
[Source: TradingView]
Net revenue for the second quarter was RMB 15.7 billion (approximately US$2.3 billion), up 6% year-over-year. The company reported a net loss of RMB 2.4 billion after accounting for an anti-monopoly penalty expense of approximately RMB 5.2 billion; excluding this expense, net income was RMB 2.7 billion. Non-GAAP net income attributable to shareholders was approximately RMB 4.8 billion, and adjusted EBITDA was RMB 4.6 billion, down from RMB 4.9 billion in the same period last year. Non-GAAP diluted earnings per ordinary share and per ADS were RMB 7.27.
The growth rate of the international business was significantly higher than the group's overall level. Revenue from Trip.com's international platforms grew over 50% year-over-year, with the Asia-Pacific region contributing the most, while European and American markets achieved faster growth off a smaller base. Inbound tourism revenue continued to maintain high double-digit year-over-year growth.
Data from Trip.com's platform showed that inbound tourism bookings in the first half of 2026 surged 95% year-over-year. In the second quarter, 118,000 hotels and over 3,600 tourist attractions handled inbound orders. The number of hotels receiving inbound orders in third-tier, fourth-tier, and fifth-tier cities grew by 38.3%, 46.2%, and 47.9% respectively, higher than the platform's overall increase of 33.6%.
By business segment, accommodation reservation revenue was RMB 6.6 billion, up 6% year-over-year; excluding a revenue deduction of RMB 122 million involved in the anti-monopoly penalty, the year-over-year growth was 8%. Transportation ticketing revenue was RMB 5.4 billion, down 1% year-over-year, affected by weak demand, rising energy prices, geopolitical tensions, and operational adjustments. Packaged-tour revenue grew 8% to RMB 1.2 billion, and corporate travel management revenue increased 11% to RMB 771 million.
Trip.com expects that the contribution of its international business to group revenue and incremental growth will continue to increase. However, business model adjustments brought by anti-monopoly rectifications and rising global travel costs may still impact the performance of domestic business and transportation ticketing revenue.
This content was translated using AI and reviewed for clarity. It is for informational purposes only.
Recommended Articles










Comments (0)
Click the $ button, enter the symbol, and select to link a stock, ETF, or other ticker.