


Oracle Stock Price Forecast: Cloud Infrastructure Revenue Surges 121%, Stock Expected to Challenge $250 Again



AI Podcast


Oracle reported fiscal 2027 first-quarter revenue of $19.3 billion and adjusted EPS of $1.92, both beating expectations, driven by a 121% surge in OCI revenue. Remaining performance obligations reached $664 billion amid strong AI contract growth. Despite heavy capital expenditures resulting in negative free cash flow, upfront customer payments mitigated cash burn. Management raised full-year guidance, alleviating market concerns regarding heavy AI spending. Following the earnings release, the stock rose over 4% in extended trading. Technically, the stock faces key resistance at $170.70, with downside support monitored at $140.
TradingKey - After the market close on September 10, Eastern Time, Oracle (ORCL) reported its first-quarter fiscal 2027 results, which significantly beat market expectations as its AI cloud business continued its rapid expansion. Oracle shares fell 5.38% to $152.94 during regular trading that day; however, market sentiment reversed quickly after the earnings release, sending the stock up over 4% in extended trading to around $159.
OCI Rises 121% as $664 Billion Order Backlog Bolsters AI Growth Expectations
According to the earnings data, Oracle's fiscal 2027 first-quarter revenue reached $19.3 billion, up 30% year-over-year, while adjusted EPS reached $1.92, up 30% year-over-year. FactSet had previously expected adjusted EPS of approximately $1.74 and revenue of about $19.14 billion, with both core metrics beating market expectations.
Total quarterly cloud revenue reached $11.6 billion, up 62% year-over-year, with Oracle Cloud Infrastructure (OCI) revenue reaching $7.4 billion, up 121% year-over-year; by comparison, SaaS cloud application revenue grew 10% to $4.2 billion.
At the same time, order backlog data also performed better than expected. As of the end of the quarter, the company's remaining performance obligations (RPO) reached $664 billion, higher than Visible Alpha's expectation of approximately $639.9 billion. Oracle added over $30 billion in new AI cloud contracts this quarter, demonstrating that despite previous market concerns over AI data center construction progress and reliance on large customers, actual order demand remains strong.
Notably, Oracle's Q1 capital expenditure reached approximately $28.5 billion, but free cash flow was negative $5.4 billion, significantly better than the negative $9.56 billion previously expected by the market. Of this, approximately $11.36 billion in capital expenditure was offset by customer upfront payments. The company stated that most of the new AI contracts do not require Oracle to bear all upfront hardware investments.
In addition, management raised its fiscal 2027 adjusted EPS guidance from $8.05 to $8.10, with full-year revenue expected to reach at least $90 billion. Second-quarter revenue is expected to grow 30% to 34% year-over-year, and adjusted EPS is expected to be $1.85 to $1.93.
Analysts believe that the biggest positive impact of this earnings report on ORCL's stock price is not merely that revenue beat expectations, but that rapid growth in OCI, continued expansion of RPO, and lower-than-feared cash burn occurred simultaneously. This helps ease market concerns over Oracle's excessive AI capital expenditure, thereby supporting the stock price.
Oracle Stock Technical Analysis
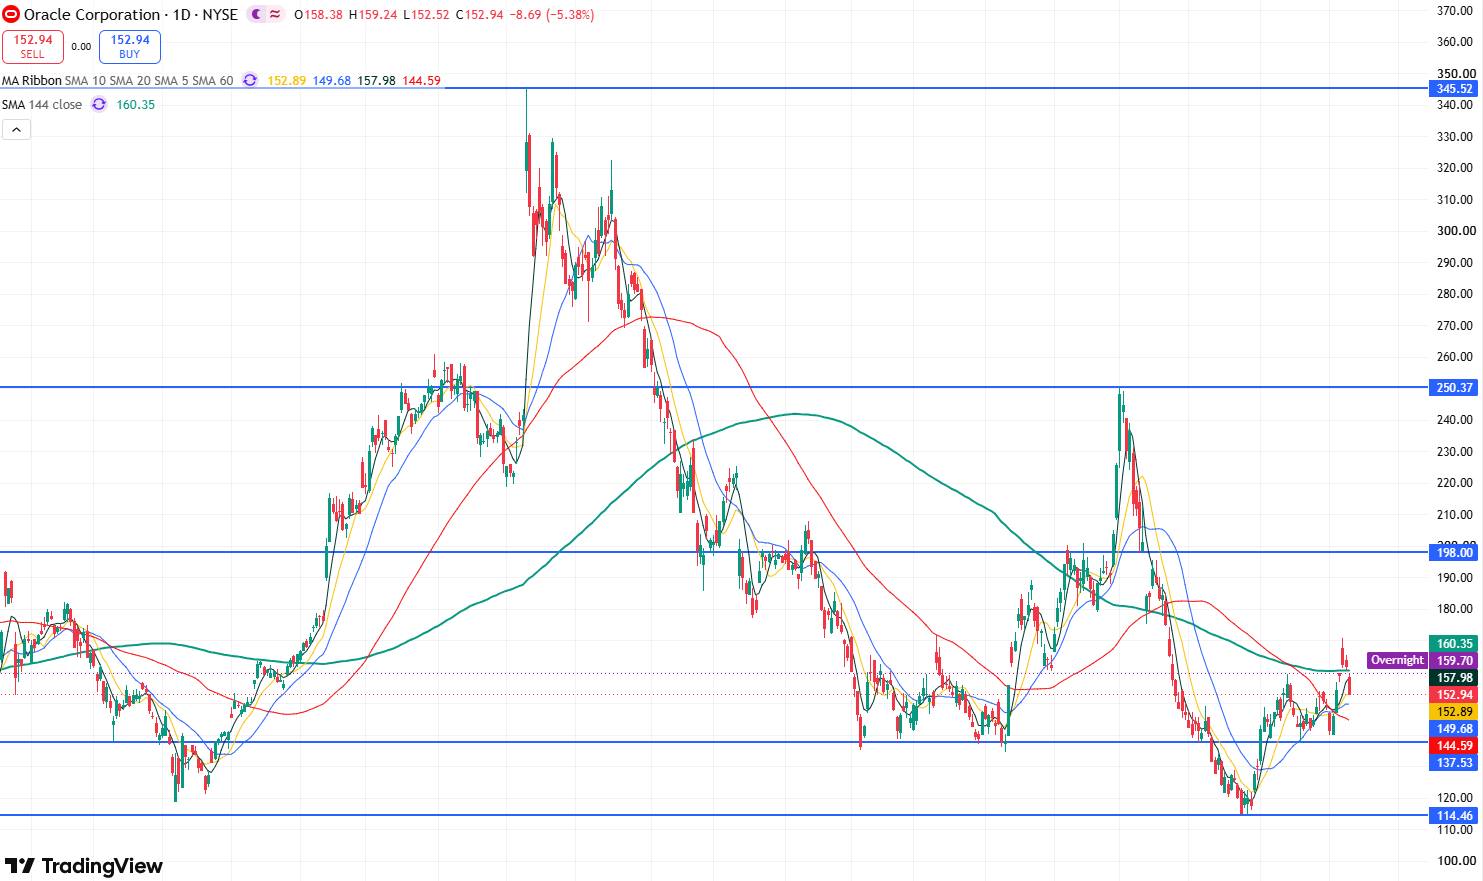
Oracle daily stock price chart, Source: TradingView
Looking at Oracle's daily stock price chart, after reaching an all-time high of $345.72 in September 2025, the stock has continued to pull back, with the overall candlestick trend exhibiting a distinct structure of lower highs and lower lows, indicating that market sentiment leans bearish. However, driven by better-than-expected earnings on Thursday, the stock rose over 4% after hours, improving short-term market sentiment and offering potential for a continued rebound in the near term.
On the upside, the primary resistance level to watch is the recent rebound high of $170.70. A breakout above this level would open up upside room toward the $200 mark. If the stock stabilizes above $200 going forward, the next upside target will likely challenge the rebound high of $250.25 from June this year.
On the downside, the primary support level to watch is $140. If this level fails to hold, the stock may move lower to test the $110–$115 range. A break below $110 could see the stock slide toward the $100 mark.
This content was translated using AI and reviewed for clarity. It is for informational purposes only.
Recommended Articles












Comments (0)
Click the $ button, enter the symbol, and select to link a stock, ETF, or other ticker.