


Broadcom Q3 Revenue Rises 86%, Slightly Beating Estimates; Shares Fall Over 6% After Hours



AI Podcast


Broadcom shares experienced volatility, falling up to 6% despite reporting strong fiscal 2026 third-quarter results on September 2 Eastern Time. Revenue surged 86% year-over-year to $29.591 billion, beating estimates, driven heavily by AI-fueled demand in the Semiconductor Solutions division. Both GAAP and non-GAAP net income and earnings per share significantly exceeded market expectations, accompanied by robust free cash flow of $13.665 billion. Furthermore, the company issued optimistic guidance, projecting fourth-quarter revenue of approximately $34.8 billion, representing accelerated 93% year-over-year growth, alongside strong projected operating margins.
TradingKey - Broadcom (AVGO) shares dropped as much as 6% after releasing its third-quarter fiscal 2026 earnings report on September 2 Eastern Time. As of press time, the decline narrowed to 3.49%, trading at $354.43.
During the period, Broadcom's revenue grew 86% year-over-year to $29.591 billion, exceeding market expectations of $29.4 billion and continuing its rapid growth driven by AI demand.
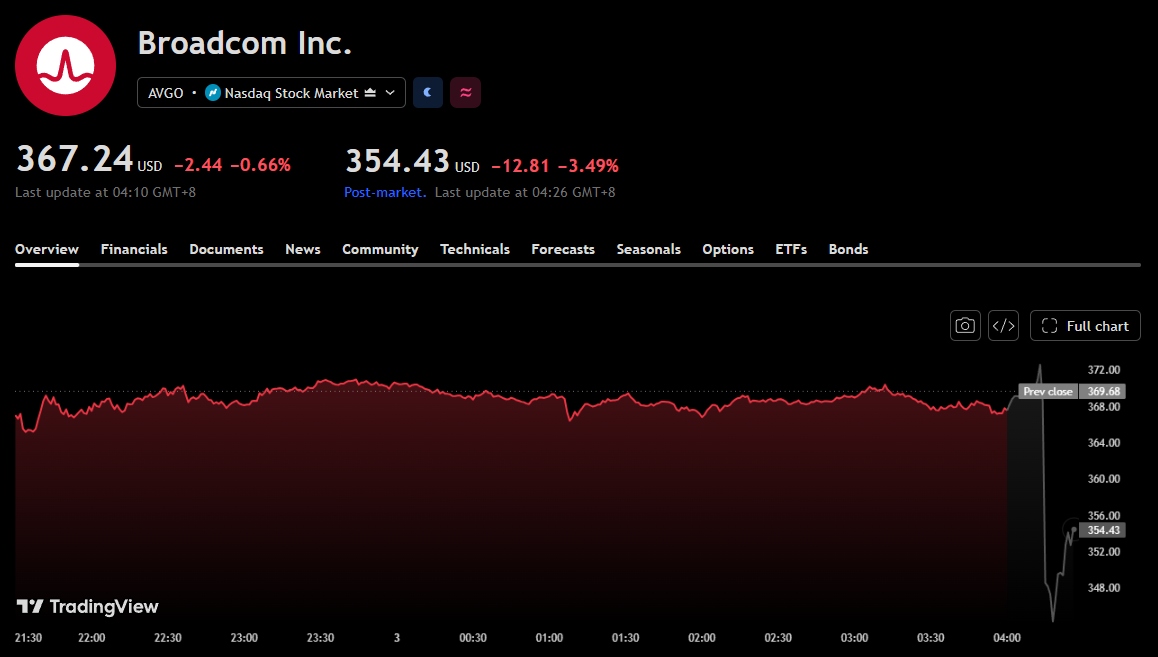
[Broadcom Stock Chart, Source: TradingView]
By business segment, revenue from the Semiconductor Solutions division reached $20.839 billion, surging 127% year-over-year, with its share of total revenue rising from 57% to 70%, serving as the absolute growth engine; revenue from the Infrastructure Software division reached $8.752 billion, up 29% year-over-year, accounting for 30%.
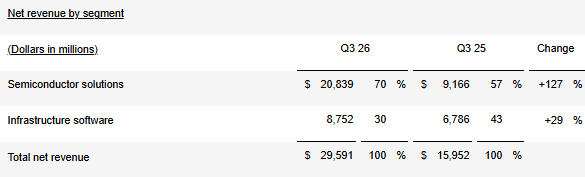
[Source: Broadcom Q3 Earnings Report]
On the profit side, GAAP net income was $13.088 billion, up 216% year-over-year, with diluted earnings per share (EPS) of $2.68, an increase of 215% from $0.85 in the same period last year. Non-GAAP net income was $16.372 billion, up 95% year-over-year, with adjusted EPS of $3.32, up 96% year-over-year and above market expectations of $3.24. GAAP operating profit reached $15.955 billion, up 171% year-over-year; non-GAAP operating profit came in at $20.095 billion, up 92% year-over-year.
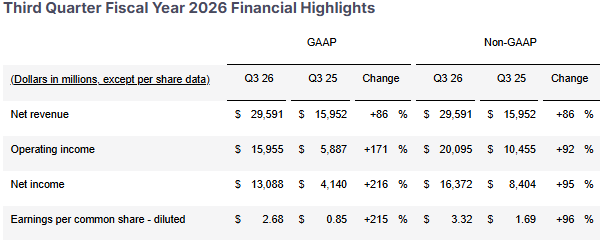
[Source: Broadcom Q3 Earnings Report]
Cash flow performance was similarly robust: operating cash flow during the period reached $14.197 billion, up 98% year-over-year; after deducting approximately $500 million in capital expenditures, free cash flow reached $13.665 billion, up 95% year-over-year and accounting for 46% of total revenue. The company also announced a quarterly dividend of $0.65 per share.
In terms of guidance, Broadcom expects fourth-quarter fiscal 2026 revenue to be approximately $34.8 billion, representing a year-over-year growth of 93%, further accelerating from the current quarter. Non-GAAP operating profit for the fourth fiscal quarter is expected to be approximately 66% of revenue.
This content was translated using AI and reviewed for clarity. It is for informational purposes only.
Recommended Articles









Comments (0)
Click the $ button, enter the symbol, and select to link a stock, ETF, or other ticker.