


Bloom Energy: In the AI Era, the Most Expensive Thing Isn't Power, But Waiting for It



AI Podcast


Bloom Energy addresses AI data center power constraints by delivering on-site solid oxide fuel cells that bypass prolonged grid interconnection bottlenecks. While a 1.2 GW agreement with Oracle validates its commercial viability, the current stock price already discounts an optimistic growth scenario. Sustaining this valuation requires successfully executing four pillars: converting large orders into recognized revenue, scaling manufacturing capacity without quality degradation, maintaining strong unit economics, and replicating major customer success across the broader industry. The company faces ongoing execution risks, including high customer concentration, natural gas dependency, and the imperative to translate prepayments into durable cash flows.

From a 325 kW Energy Server to a 1.2 GW Oracle Order: How Bloom Turned Grid Bottlenecks Into Growth, and How Much the Market Has Priced In
Suppose an AI data center has been built and tens of thousands of GPUs delivered to the site, only for the grid to tell you that additional power capacity will take several more years. For an ordinary project, this is merely a delay; for an AI data center, it means billions of dollars in equipment depreciating while generating zero revenue.
What Bloom Energy does is very concrete: place Energy Servers next to a customer's campus, connect them to natural gas and air, and generate power directly on-site. A single unit has a net output of about 325 kW; hundreds can form a 100 MW power source, and thousands can scale up to gigawatt-level projects. Time-to-Power, put simply, is how long it takes from project approval to delivering stable electricity into the servers.
Bloom does not necessarily provide the cheapest electricity, but it allows customers to get power sooner. Oracle's signing of a 1.2 GW agreement proves that large AI customers are willing to adopt this solution; what remains to be verified is whether Bloom can reliably manufacture thousands of units, maintain profit margins, and replicate Oracle's success across more customers.
I. What AI Lacks Is Not Power Generation Technology, but Power Delivered on Schedule
1.1 Electricity demand is surging, while power infrastructure moves at a different pace
Bloom's opportunity stems first from a speed mismatch: AI data centers are being constructed faster than ever, but new power sources and grid infrastructure still take several years to build.
U.S. data center electricity consumption rose from 58 TWh in 2014 to 176 TWh in 2023, accounting for 4.4% of total U.S. power consumption. Lawrence Berkeley National Laboratory estimates that this could reach 325–580 TWh by 2028, pushing its share up to 6.7%–12%; an updated projection in 2025 further raised the 2030 scenario range to 9.5%–15.3%. While these are not definitive forecasts, they illustrate that the power grid is facing a concentrated surge in new load for which it was not prepared over the past decade.
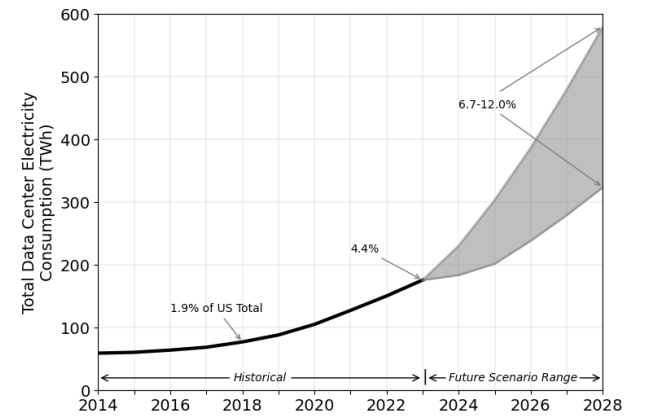
Source: Lawrence Berkeley National Laboratory
By the end of 2025, about 8,200 power generation and energy storage projects were queued up for grid interconnection in the U.S., with a total capacity exceeding 2,060 GW. For projects ultimately commissioned in 2025, the median time from submitting an interconnection request to commercial operation exceeded five years.
This is not a direct statistic on data center connection times, but rather a bottleneck further upstream: even projects intended to add supply to the grid must wait in line for years first. "More power in the future" does not mean that power will arrive in time for data center construction schedules.
1.2 What Bloom shortens is the supply path, not eliminating all engineering
Bloom can deliver power faster because it moves the generation step right next to the data center.
Conventional power supply must sequentially undergo remote power plant construction, grid interconnection approvals, transmission line expansion, and local substation upgrades before finally delivering new power to the data center. Bloom places its generation equipment inside the campus, generating electricity as soon as natural gas reaches the site, thereby bypassing some of the slowest stages.
The fastest approach is for the campus to be powered primarily and independently by Bloom, remaining electrically independent of the public grid—known as "islanded operation." If customers retain a connection to the public grid, they can use grid power when it is cheaper and have an added layer of backup during Bloom maintenance or gas supply interruptions; however, running two power sources in parallel still requires safety and capacity reviews, which may reintroduce grid connection delays.
Thus, Bloom does not eliminate the need for all infrastructure. It still requires natural gas pipelines, land, switchgear, local permits, and construction; what it truly saves are the stages along the conventional power supply path that are most prone to project delays.
1.3 When waiting itself is expensive, evaluating only the cost per kWh is insufficient
Consequently, Bloom's commercial value cannot be measured by electricity prices alone.
Levelized Cost of Electricity (LCOE) sums all expenditures—from equipment construction, financing, fuel, and maintenance to decommissioning—and divides them by the total electricity generated over the asset's lifecycle. It is well-suited to answering "what is the average cost per kWh," but it fails to fully account for the losses caused by idle GPUs and delayed operational deployment.
If a 100 MW data center operates at an average of 90% capacity year-round, that equates to an average load of 90 MW. Multiplied by 8,760 hours in a year, its annual power consumption is approximately 788,400 MWh. Assuming Bloom costs $10, $20, or $40 more per MWh than alternative options, the customer would pay roughly $7.88 million, $15.77 million, or $31.54 million more annually, respectively.
This is not Bloom's actual pricing, but an opportunity cost calculation. The real question is: is paying an extra $31.54 million to get power earlier lower than the loss caused by letting billions of dollars worth of GPUs sit idle for a year?
Therefore, Bloom's strongest market is not all data centers, but the segment where customers cannot afford to wait and conventional grid power cannot arrive on time.
II. Why 325 kW Building Blocks Suit AI Data Centers
2.1 Bloom is primarily an on-site power generation equipment company
Bloom fits this market not because any single technical parameter stands out exceptionally, but because several characteristics of SOFC happen to align with data center requirements simultaneously.
The Energy Server uses SOFCs (Solid Oxide Fuel Cells), which can be understood as high-temperature fuel cells continuously supplied with natural gas and air. While gas turbines rely on combustion to drive mechanical power generation, SOFCs produce electricity directly via electrochemical reactions at approximately 800°C.
The absence of a traditional flame means local emissions of nitrogen oxides, sulfur oxides, and particulate matter are very low, with minimal noise and operational water usage, making permits easier to obtain; however, since natural gas contains carbon, carbon dioxide is still emitted.
In the second quarter of 2026, Bloom's product revenue reached approximately $935 million, accounting for nearly 88% of total revenue. In other words, it is currently first and foremost an advanced equipment manufacturer selling Energy Servers, while hydrogen energy is not yet a primary driver of profits.
2.2 How single 325 kW units scale up to 1 GW
The first capability that makes Bloom truly suitable for data centers is breaking down large-scale power capacity into numerous standard modules.
Power Scale | Approximate Number of Energy Servers Needed |
10 MW | 31 units |
100 MW | 308 units |
1 GW | 3,077 units |
Oracle signed for 1.2 GW | Approx. 3,692 units |
Bloom's annualized capacity of 2 GW | Approx. 6,154 units/year |
All figures above are theoretical conversions excluding backup equipment. Single-unit power output is based on the company's 325 kW product specification.
Customers can start by deploying 30 MW to power up the first data hall, then scale up to 50 MW or 100 MW as more servers arrive. While equipment is being manufactured in the factory, ground foundation, gas, and electrical systems can be prepared on-site concurrently, so manufacturing and construction do not need to be entirely sequential.
Modularity also lowers the cost of backup capacity. Mission-critical facilities are rarely designed to be "just enough"; instead, they add backup units on top of the N units required for normal load, representing N+1 redundancy. While a single unit of a large gas turbine might be tens of megawatts, Bloom can add redundancy at a granularity of 325 kW.
2.3 Designed for continuous power supply, not cold backup generation
Bloom's second advantage is that equipment can be standardized for mass production and installed in phases.
The company disclosed that under specific project conditions, on-site power can be achieved in about 90 days; its latest Power Connect further shifts part of the electrical integration from the construction site to the factory, which the company claims can shorten site installation time by over 40%. These metrics indicate that Bloom can compress construction cycles, though they do not constitute a fixed guarantee for every project.
Solid oxide fuel cells must maintain high temperatures over long periods and take time to restart once completely cooled. Consequently, they are better suited as a 24/7 primary power source rather than functioning like diesel generators that remain off normally and start seconds after a blackout. Data centers still require uninterruptible power supplies (UPS), batteries, or other equipment to handle instantaneous outages and extreme backup scenarios.
2.4 Boundaries of Bloom's advantages: Natural gas remains a prerequisite
While Bloom bypasses part of the grid bottleneck, it increases reliance on natural gas infrastructure.
The Energy Server has an average lifecycle electrical efficiency of about 54%. Based on this calculation, generating 1 MWh of electricity requires approximately 6.3 MMBtu of natural gas. For every $1/MMBtu increase in natural gas prices, power generation costs rise by roughly $6.3/MWh. For the aforementioned 100 MW data center, this adds about $5 million annually.
Who bears the fuel cost depends on the contract, but a more fundamental issue is pipeline capacity: if there is insufficient natural gas capacity near the campus, Bloom cannot be deployed even if it bypasses the electric grid.
The combined heat and power (CHP) efficiency of over 90% touted by the company adds generated electricity and effectively utilized waste heat together; it does not mean 90% of the natural gas is converted into electricity. If a data center lacks a stable application for waste heat, it cannot capture the full benefit.
800V DC and hydrogen are likewise better treated as upside options for the future. Bloom fuel cells natively produce DC power first; if future data centers transition to 800V DC backbones, theoretical conversion losses could be reduced. However, current Energy Servers primarily output AC power. Neither hydrogen fuel nor electrolyzers are currently significant sources of profit, so neither is factored into the baseline valuation.
2.5 Bloom wins on combination, not single-parameter leadership
Reciprocating natural gas engines are typically cheaper and faster to start; gas turbines have higher single-unit capacity and may offer lower generation costs for large-scale projects. Bloom's true competitiveness lies in combining deployment speed, low local pollution, modularity, and continuous power delivery simultaneously, backed by years of field operational data and major customer validation.
Small Modular Reactors (SMRs) may become stronger long-term competitors in the 2030s by offering stable, low-carbon power. However, initial projects still face licensing, cost, and construction risks, so their impact on Bloom's signed projects scheduled for deployment in 2026–2030 is limited.
The real long-term risk is that customers use Bloom to solve today's power shortage, and then scale back follow-on orders years later once the public grid, gas turbines, or SMRs come online. If this occurs, Bloom might remain a good business, but the long-term growth expectations and valuation multiples the market is willing to assign to it will compress.
III. Current Stock Price Already Demands Bloom Approach an Optimistic Scenario
Bloom's industrial logic has been validated. Therefore, the key question for the stock right now is not "is the company good," but rather how much success is already priced in.
3.1 Current price is near the upper bound of fair value under an optimistic scenario
Valuation can be distilled into two questions: how much operating profit Bloom can achieve by 2030, and what price the market will be willing to pay for each dollar of operating profit at that time.
Using the 115 MW acceptance in H1 2024 corresponding to roughly $380 million in product revenue as a rough anchor, revenue per GW of product is about $3.3 billion. Accounting for installation, service, and customer mix changes, a group revenue of $7 billion by 2030 roughly corresponds to annual deliveries of 2–2.5 GW, $10 billion corresponds to 3–3.5 GW, and $14 billion corresponds to 4–5 GW. This conversion is intended solely to establish a physical scale, not as a precise forecast.
Valuation uses a normalized operating margin close to GAAP, retaining standard stock-based compensation, warranty costs, and customer incentive amortization.
Scenario | 2030 Revenue and Approximate Delivery Scale | Normalized Operating Margin | 2030 Operating Profit Multiple | Discounted Fair Value |
Bear Case | $7 billion; approx. 2–2.5 GW | 14%–16% | 15x–18x | Approx. $38–$49 per share |
Base Case | $10 billion; approx. 3–3.5 GW | 18%–20% | 18x–22x | Approx. $74–$98 per share |
Bull Case | $14 billion; approx. 4–5 GW | 22%–24% | 24x–27x | Approx. $159–$193 per share |
The Bear Case corresponds to gradual improvements in grid expansion and gas turbine supply, along with rising commercial credibility of SMRs, which reduces Bloom's Time-to-Power premium. The Base Case assumes Bloom remains a vital distributed and transition power source. The Bull Case requires grid bottlenecks to persist longer, slower SMR progress, and multiple major customers adopting Bloom as a standard solution.
As of August 20, 2026, BE's stock price stood at $202.48, already above the upper bound of fair value in this optimistic scenario.
3.2 What current price really implies: Bloom must outpace even the optimistic scenario
If an investor buys today at $202.48 and seeks an annualized return of roughly 10% by the end of 2030, BE's stock price would need to reach approximately $307 by then.
Thus, Bloom merely proving by 2030 that it was "worth $202 today" is not enough; it must continue growing sufficiently to support a valuation above $300.
If the market remains willing to grant Bloom a high 30x operating profit multiple in 2030 while normalized operating margins reach 23%, the company would still need annual revenue of around $14 billion. This approaches an annual delivery scale of 4–5 GW, implying that the theoretical capacity of ~5 GW at its Fremont plant would be nearly fully utilized.
If the industry matures somewhat by 2030 and the market is only willing to pay 24x operating profit while Bloom's margin is 22%, required revenue would rise further to approximately $18.3 billion. This would likely require expanding beyond the existing 5 GW facility footprint or significantly increasing revenue generated per GW.
Hence, what makes the current valuation demanding is not merely that it assumes Bloom will grow, but that it simultaneously assumes long-term rapid growth, sustained high margins, and the preservation of a growth-company valuation multiple through 2030.
The third question then becomes: what operational milestones must occur for Bloom to deliver on these expectations?
IV. Four Pillars That Must Deliver Simultaneously to Support Today's Price
The answer can be summarized in a simple chain:
Orders must turn into revenue, revenue relies on manufacturing capacity for delivery, delivered units must maintain profitability, and finally, Oracle's success must be replicated across more customers. If any single link fails, the optimistic valuation above will be compromised.
4.1 Pillar 1: 1.2 GW must truly convert into revenue
Oracle has signed and begun deploying 1.2 GW, theoretically corresponding to roughly 3,692 Energy Servers; 2.8 GW is merely the cap of the partnership framework, and the remaining portion cannot yet be considered definitive orders.
Brookfield's $25 billion framework helps facilitate project implementation: capital providers or project companies purchase equipment upfront, allowing data centers to pay gradually through long-term Power Purchase Agreements (PPAs), thereby reducing upfront capex for customers. However, $25 billion represents financing capacity, not committed orders or revenue earned by Bloom.
Bloom must wait until equipment reaches contractual milestones—such as customer acceptance, mechanical completion, or commercial operation—before recognizing revenue. Therefore, evaluating Oracle requires looking beyond the raw "1.2 GW" figure. What truly determines economic value is how many megawatts are actually accepted, how much revenue is recognized per megawatt, and how much gross profit is ultimately retained.
By the same logic, out of the ~$20 billion total backlog at year-end 2025, product backlog accounts for about $6 billion, while a large portion of the remainder represents multi-year service value. Total backlog cannot be treated entirely as equipment orders.
4.2 Pillar 2: Bloom must actually manufacture thousands of qualified units
For orders to translate into revenue, production capacity must keep pace.
Bloom's manufacturing base in Fremont, California is the core facility for current Energy Server expansion. The company plans to raise its annualized capacity from 1 GW to 2 GW by the end of 2026, with existing facilities theoretically expandable up to ~5 GW. Beyond 2 GW, the company estimates that each additional 1 GW of capacity requires 6–9 months and $100 million–$150 million in capital expenditure.
If Oracle's 1.2 GW were delivered entirely in a single year, it would consume 60% of a 2 GW annual capacity. While actual project deliveries span multiple periods, this proportion illustrates that Bloom is transitioning from "searching for orders" to "allocating capacity."
The real challenge involves more than just adding assembly lines. Ceramic yield rates, critical raw materials, testing, skilled labor, inventory, and site installation must all scale together. In H1 2026, inventory rose from $643 million to $758 million, and long-term supplier prepayments increased noticeably, indicating the company is locking in resources in advance.
There is also a supply chain controversy worth monitoring. In July 2026, short-seller Hunterbrook raised questions over whether Bloom indirectly relies on Chinese supply chains for certain scandium materials. Bloom subsequently denied this, stating that current supplies are sufficient for present demand and backlog. Public information is currently insufficient to fully verify either claim, but it reminds investors that 5 GW is merely the theoretical capacity the factory can house; actual output must be proven by key materials, manufacturing yields, and final customer acceptances.
4.3 Pillar 3: Unit economics must not deteriorate as deliveries scale
Even if equipment can be produced, scaling up is meaningless if selling an extra unit brings no incremental profit.
In Q2 2026, Bloom's revenue reached $1.065 billion, up 166% year-over-year; product revenue reached $935 million with a product gross margin of 36.5%, driving GAAP operating income to $182 million. As product volumes ramped up, fixed costs were spread over more units, and operational leverage began to materialize.
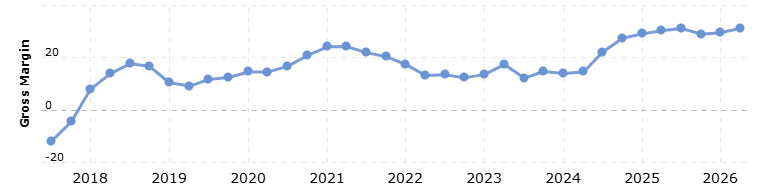
Source: Macrotrends
However, profits are primarily derived from Energy Server products. Revenue from Bloom's other segments—such as installation—had a negative gross margin of 3.6%, resembling low-margin civil construction; service gross margin stood at 18.7%, which, while recurring, still bears personnel, spare parts, and stack replacement costs.
Whether gross margins can continue to improve depends not simply on "producing more," but on whether each unit can be made cheaper and more durable.
In Q2, the company took a $58.3 million warranty charge for specific issues; warranty and product performance liabilities rose from ~$20.01 million at year-end 2025 to $77.8 million. A single provision does not prove systemic quality issues, but if further additions persist in the future, it could imply that manufacturing yields or stack lifespans are below expectations.
Cash flow quality must also be scrutinized. In H1 2026, Bloom generated roughly $300 million in operating cash flow; during the same period, cash inflows from increases in deferred revenue and customer deposits reached about $301 million—matching the entire scale of operating cash flow. Put simply, some customers paid cash upfront before equipment was delivered and before Bloom recognized revenue.
This is undoubtedly positive for Bloom during expansion: customer prepayments directly help the company purchase materials, build inventory, and expand capacity, reducing reliance on external financing. However, this money does not equate to profits earned in the current period, and the same prepayment will not generate another cash inflow upon equipment delivery. Therefore, as scale increases, a crucial test will be whether Bloom can sustain operating cash flow through higher product margins and improved working capital management, even if customer prepayment growth slows.
Thus, true success in scaling up is not merely rising revenue and gross margins, but falling unit costs, stable warranty expenses, and profits converting naturally into cash rather than relying primarily on customer prepayments from new orders.
4.4 Pillar 4: Replicability across major customers must be validated
The final condition is proving that Bloom is selling not just a one-off megadeal, but a replicable industry solution.
AEP has placed an initial 100 MW order under a procurement agreement of up to 1 GW, and Equinix's operational and under-construction capacity also exceeds 100 MW. However, in Q2 2026, a single contracted customer accounted for 73% of revenue; in H1, the top two customers contributed 44% and 21%, respectively.
High customer concentration means that the acceptance timeline, procurement pace, and bargaining power of a single major client could significantly swing Bloom's quarterly revenue and gross margins.
Therefore, whether second and third multi-hundred-MW customers emerge beyond Oracle will be one of the most vital metrics to watch over the coming years. Only by diversifying its revenue base can Bloom prove it is transitioning from a vendor reliant on major client projects to a standard power platform for AI data centers.
At this point, the investment thesis for Bloom is quite clear. Power shortages for AI data centers represent a real demand, and the Energy Server has demonstrated its ability to secure GW-scale projects. Going forward, what dictates the company's value is no longer whether market demand exists, but whether Bloom can reliably turn orders into revenue, expand capacity profitably, and replicate Oracle's success with additional customers. If any link falls noticeably short of expectations, the growth already priced into the stock will need to be re-rated.
A new Bloom has emerged, but a good company is never synonymous with a good stock. The current price demands that it evolve from a company with the right product into a global AI power platform with almost zero margin for error.
This content was translated using AI and reviewed for clarity. It is for informational purposes only.
Recommended Articles












Comments (0)
Click the $ button, enter the symbol, and select to link a stock, ETF, or other ticker.