


Nokia Stock Price Forecast: Can It Surge to $100 in the Next 5 Years?



AI Podcast


Nokia’s stock price over the past decade has traversed four distinct phases: a volatile decline, a retail-driven surge, a 5G-induced downturn, and an AI-fueled optical network boom. Recently, the stock retreated sharply from its peak due to escalating restructuring costs, component shortages, and profit-taking, with potential retesting of the $8 level ahead. Driven by business adjustments, telecom cycles, and AI integration, Nokia faces severe structural and financial constraints—such as the requirement for a $550 billion market capitalization—making a $100 share price by 2030 highly improbable.

A Review of Nokia’s Price Action Over the Past Decade
TradingKey - From 2016 to present, Nokia (NOK) has gone through four core stages over the past decade: volatile decline, post-surge pullback, bottoming out, and another surge.
From 2016 to 2019, Nokia's stock price was generally in a volatile downward trend. At the beginning of 2016, after starting at $7.5, Nokia stock continued to weaken amidst volatility and fell to a low of $3.3 by the end of 2019. From 2020 to 2021, Nokia experienced a meme stock frenzy; its share price first plummeted to near $2.3 and then surged continuously, reaching $9.70 in less than a year, before falling back rapidly to trade on fundamentals, fluctuating within the $4–$6 range.
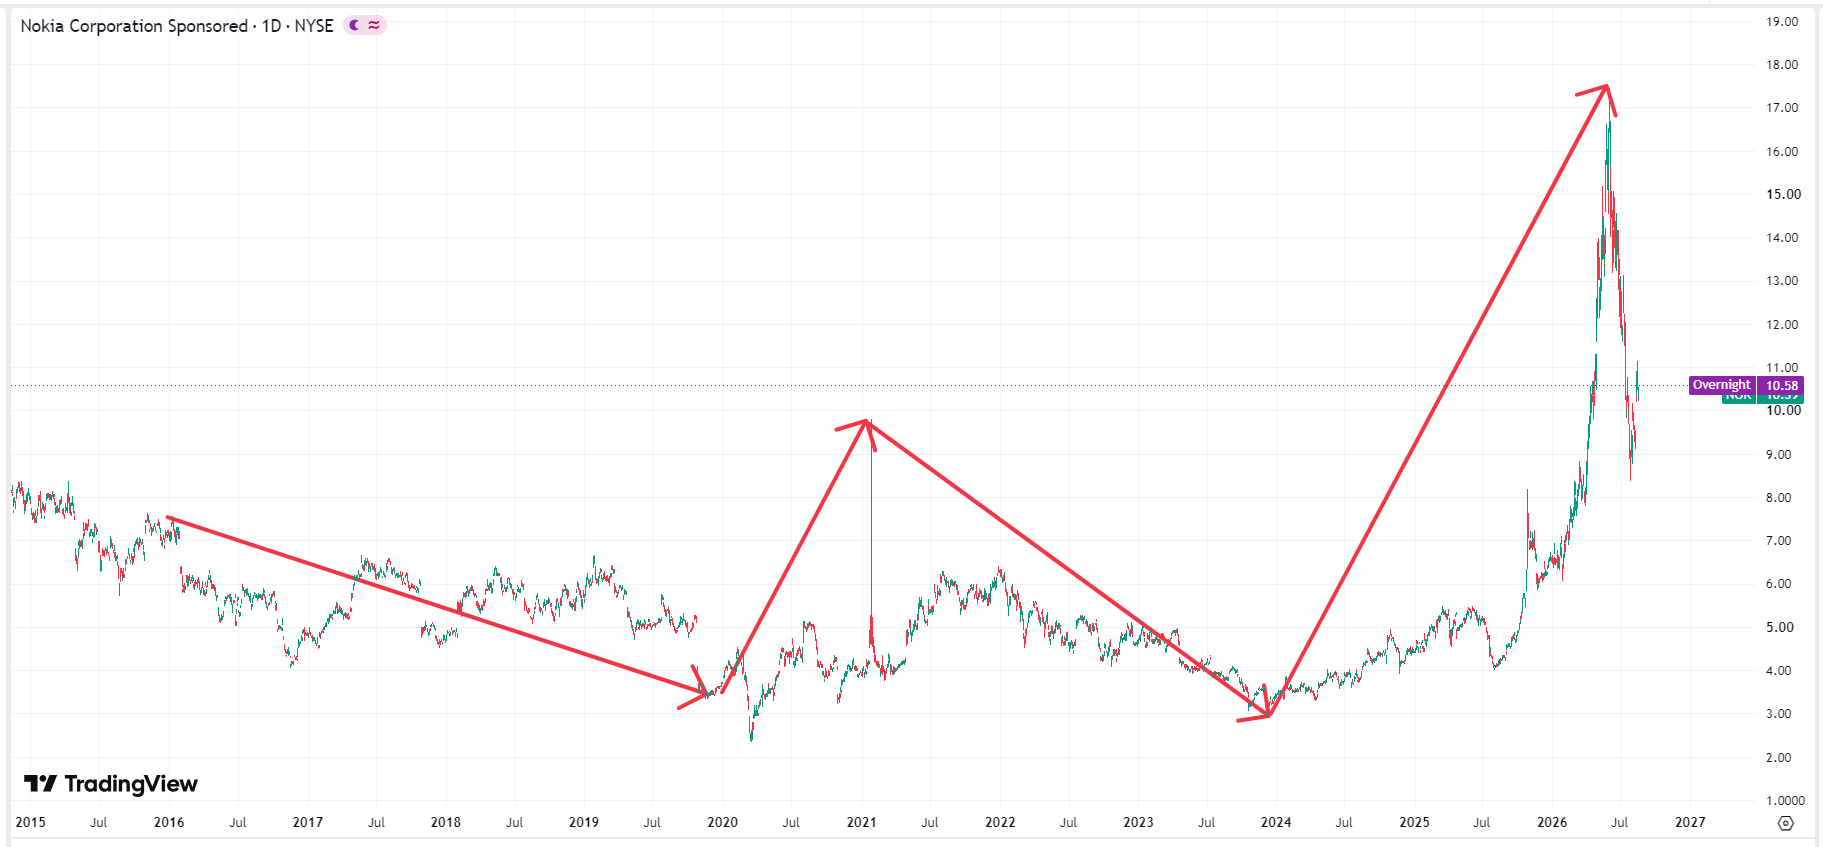 Nokia stock price chart, Source: TradingView
From 2022 to 2023, Nokia stock was sold off again, causing its share price to continuously weaken, falling from $6.5 to around $3. From 2024 to 2026, Nokia's stock price embarked on a long bull run, crossing the $100 billion market cap threshold in 2026, with the high reaching above $17 at one point, and currently falling back to around $10.
What Factors Affect Nokia's Price Movements?
Over the past decade, Nokia's stock price movements were primarily driven by its business adjustments, reflected in four key areas: restructuring and M&A integration costs, strategic choices in technology roadmaps, telecom industry cycles, and the AI transformation wave, as detailed below:
Period | Key Drivers |
2016–2019 | High costs from acquiring Alcatel-Lucent, 5G R&D missteps, dividend suspension |
2020–2021 | Pekka Lundmark appointed CEO and initiated reforms, retail short squeeze frenzy |
2022–2023 | Telecom operators' 5G capex freeze, loss of AT&T order |
2024–2026 | Boom in AI data center optical networking, surge in AI/Cloud orders |
Will Nokia's Price Continue to Fall This Year?
Nokia's stock price surged to a multi-year high of $17.45 in June before plunging between June and July to a low near $8.3, resulting in a maximum drawdown of 52%. This sharp decline was not caused by a deterioration in the company's fundamentals at the time, but rather a valuation adjustment triggered by a combination of upstream memory chip shortages and soaring costs, an upward revision of restructuring costs (substantially increased from 250 million euros to 800 million euros), and profit-taking at high levels.
With cash outflows stemming from restructuring and the closure of R&D centers (such as the Hangzhou R&D center), Nokia remains in the painful transition of global layoffs and business transformation in the second half of 2026. The stock price may retest the $8 level, which represents the upper rail of the consolidation platform formed between October 2025 and April 2026 and provides very strong support. However, will NOK's stock price break below this level and move down to test the $6 line of defense? Such a scenario is unlikely, unless the shortage of DRAM/HBM memory components continues to worsen, causing some optical communication equipment shipments in the second half of the year to be deferred to 2027.
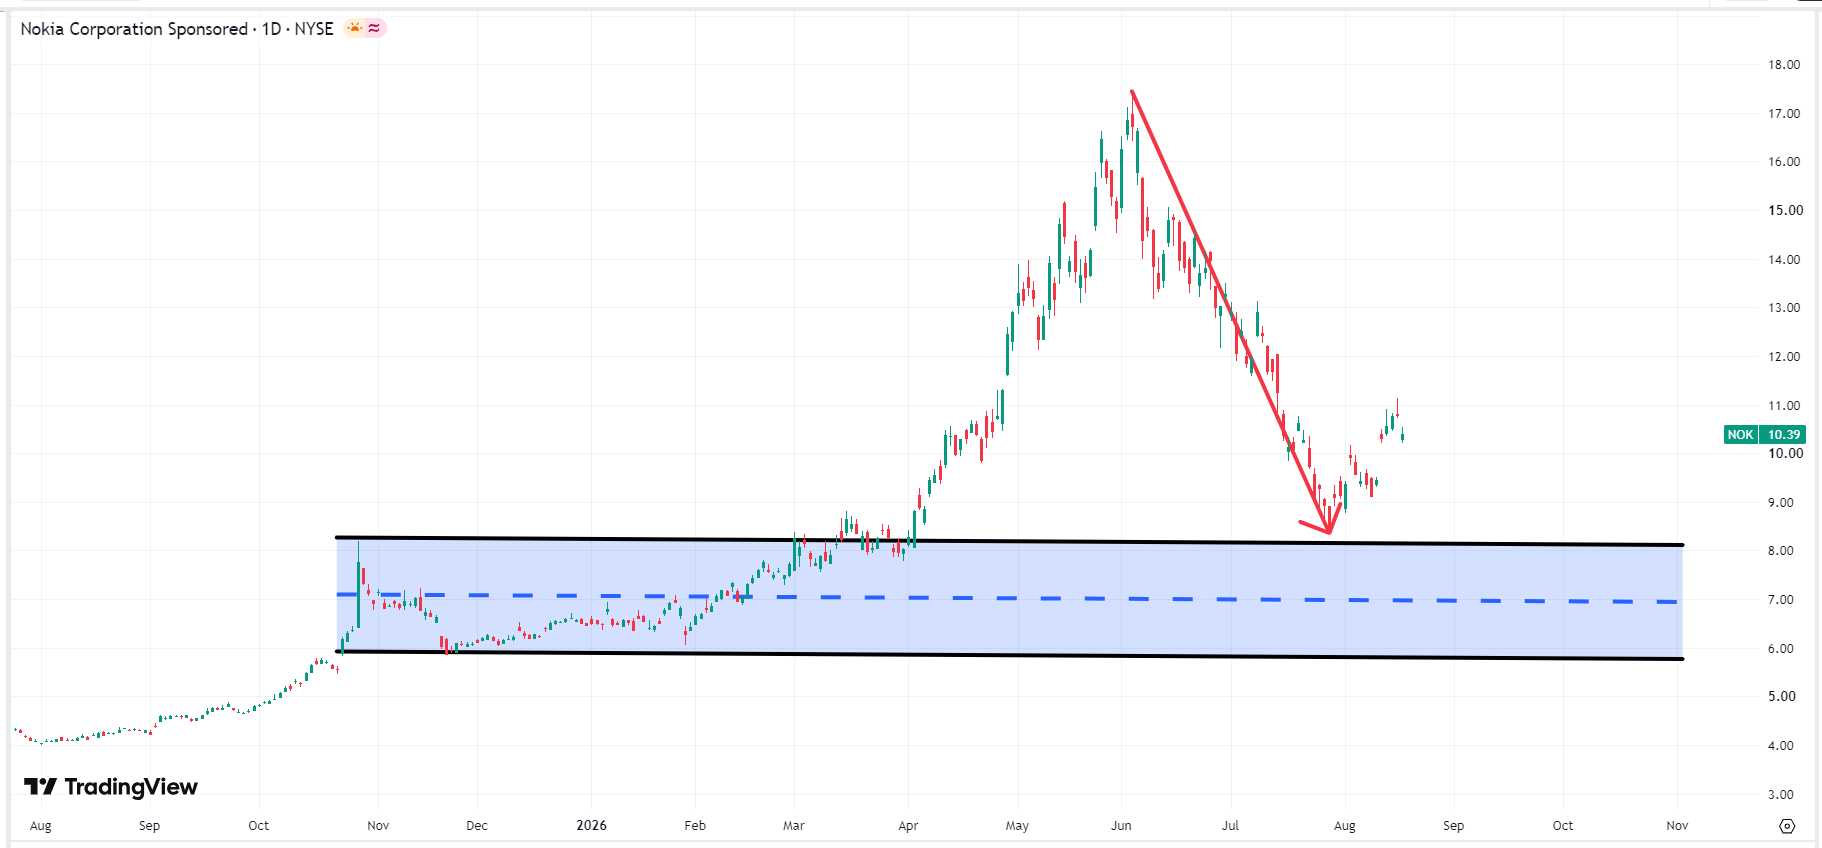 Nokia stock price chart, Source: TradingView
Can Nokia Rise to $100 by 2030?
From the perspective of capital market structure and financial models, the probability of Nokia's stock price reaching $100 before 2030 is extremely low. Nokia currently has approximately 5.5 billion shares outstanding, and a $100 stock price would mean its total market capitalization would surge to $550 billion, equivalent to the scale of top chip giants such as Broadcom (AVGO) or AMD (AMD).
For Nokia to achieve this scale, based on a reasonable forward price-to-earnings (P/E) ratio of 20x for tech hardware and networking equipment, Nokia's annual net profit would need to reach $27.5 billion by 2030. With its current annual operating profit hovering around the $2.5 billion range, this means profits would have to increase by more than 10 times—a feat that is simply unachievable within the total market pool of global telecom and data center networking equipment.
Conclusion
Over the past decade, Nokia has experienced four distinct phases: a volatile decline, a retail trading frenzy, a 5G winter, and an AI optical network surge. In June this year, although NOK's stock price surged to $17.45 due to AI demand, it sharply plummeted to around $8.30, weighed down by restructuring costs rising to 800 million euros, chip shortages, and profit-taking. Although there is a risk of retesting the $8 level in the second half of the year, the probability of falling below $6 is low. Furthermore, constrained by the financial reality of requiring a $550 billion market capitalization and a tenfold increase in profits, the likelihood of reaching $100 by 2030 is extremely low.
This content was translated using AI and reviewed for clarity. It is for informational purposes only.
Recommended Articles












Comments (0)
Click the $ button, enter the symbol, and select to link a stock, ETF, or other ticker.