


Tesla Stock Forecast: Cybercab Test Rides Open at Month-End, Stock May Rebound to $400



AI Podcast


On August 21, Eastern Time, Tesla shares rose over 4% above $360, driven by plans to launch public test rides for its steering-wheel-free Cybercab in Austin, Texas. JPMorgan highlighted FSD v15 as a key inflection point for Robotaxi deployment. Tesla projects significant long-term unit cost reductions through dedicated Robotaxi operations. Technically, the stock is experiencing a short-term recovery, reclaiming key moving averages. However, it faces strong resistance at the $365.12–$370.26 band. A failure to break this zone risks consolidation or a retest of support levels, while a successful breakout targets higher Fibonacci retracement levels.

TradingKey - On August 21, Eastern Time, Tesla (TSLA) rose over 4%, with its share price returning above the $360 mark.
According to media reports, Tesla plans to open test rides for Cybercab—its first autonomous taxi with no steering wheel or pedals—to the public by the end of this month, and formally integrate it into its Robotaxi network in Austin, Texas.
According to people familiar with the matter, the deployment will proceed in two phases: first, offering test rides to internal employees on public roads, and after several days of successful internal testing, incorporating the Cybercab into the existing Robotaxi fleet—currently dominated by the Model Y—to open it to all users.
Cybercab is reportedly a two-seater vehicle designed by Tesla specifically for fully autonomous driving scenarios. The vehicle completely eliminates the steering wheel and brake pedal, relying entirely on Tesla's Full Self-Driving (FSD) system to operate. The Texas Department of Transportation has confirmed that the design without manual controls complies with local regulations.
JPMorgan stated that the next major deployment inflection point for the Robotaxi fleet is directly linked to the launch of FSD v15. Management characterized v15 as a step-function upgrade in performance, comparable to the previous leap from v13 to v14—which involved a significant increase in parameter count, context window expansion, and an approximately 20% reduction in latency. FSD v15 encompasses seven core technologies, about 40% of which are currently being tested in the Robotaxi fleet with positive feedback.
Regarding unit economics, Tesla disclosed that under personal vehicle utilization, the total cost of ownership (TCO) for the Model Y and Model 3 is approximately $0.60 to $0.70 per mile; under typical Robotaxi utilization (4 to 5 times higher than personal use), it can drop to $0.50 to $0.60 per mile, significantly lower than the current ride-hailing platform rates of about $2.50 to $3.00 per mile. Management also emphasized that the long-term target market for Robotaxi far exceeds traditional ride-hailing (which accounts for only a low single-digit percentage of the overall mobility market), aiming to drive TCO down to about $0.30 per mile through a dedicated Robotaxi platform. The Cybercab is only the initial form factor, with more models to follow.
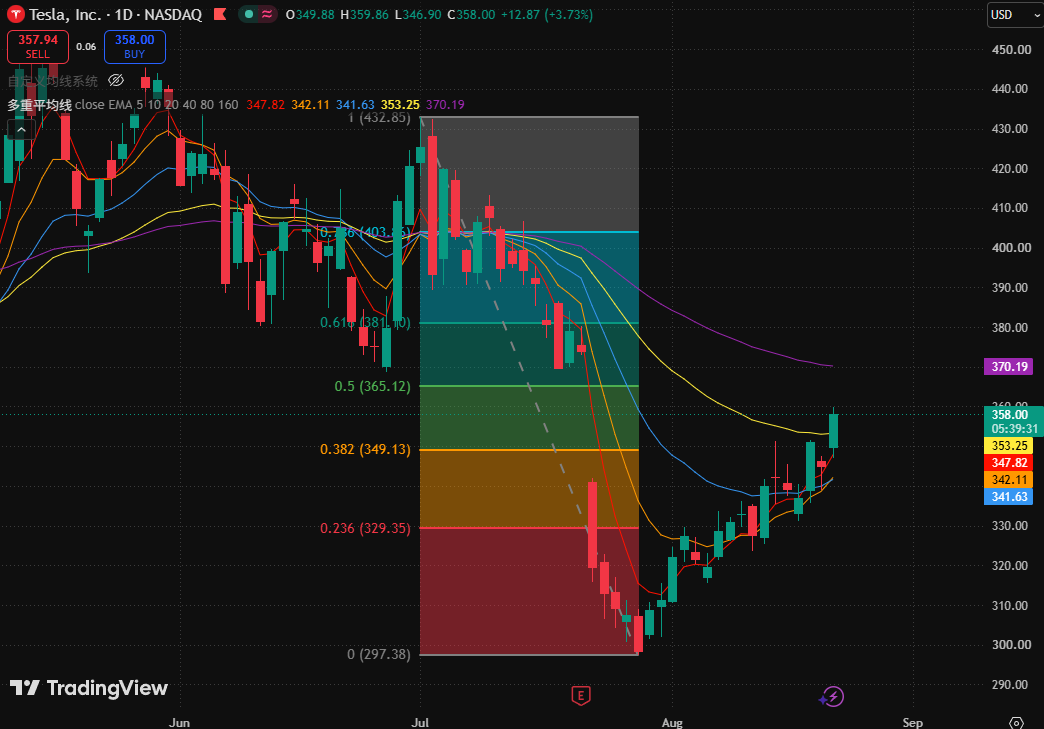
Tesla daily chart, Source: TradingView
After rebounding from near its periodic low ($297.38), Tesla's share price reclaimed its 5-day moving average ($348.72), 10-day moving average ($342.61), 20-day moving average ($341.89), and 40-day moving average ($353.38), continuing its short-term technical recovery.
However, the stock has not yet broken above the 0.5 Fibonacci retracement level ($365.12) and the 80-day moving average ($370.26), leaving the medium-term trend reversal not fully confirmed for now.
Currently, the stock price pulled back after testing highs near the $365.12–$370.26 resistance band. If it fails to effectively break above and hold this zone, the short-term rebound could revert to consolidation or even retest the 40-day moving average ($353.38) and the 0.382 Fibonacci retracement level ($349.13).
If the daily chart falls back below $349.13, the rebound structure will weaken significantly; if it further drops below the 0.236 Fibonacci retracement level ($329.35), it would imply that this round of rebound might fail, risking a retest of the previous low region around $297.38.
If the stock effectively holds above $365.12 and further breaks through $370.26, the upside targets for the rebound could be the 0.618 Fibonacci retracement level ($381.10) and the 0.786 Fibonacci retracement level ($403.86).
This content was translated using AI and reviewed for clarity. It is for informational purposes only.
Recommended Articles











Comments (0)
Click the $ button, enter the symbol, and select to link a stock, ETF, or other ticker.