


Valero Energy Q2: Revenue $44.48B Beat, EPS $12.54 Crushes Estimates, Refining Profit Surges 247% on Tight Supply



AI Podcast


Valero Energy reported record second-quarter revenue of $44.48 billion and adjusted EPS of $12.54, significantly beating consensus estimates. Net income surged 419% year-over-year to $3.7 billion, driven by strong refining margins and global supply imbalances. The company returned $2.6 billion to shareholders, raised its dividend to $1.20, and maintained a robust balance sheet with an 11% net debt-to-capital ratio. While structural refining dynamics support a higher margin floor, key risks include potential economic slowdowns and geopolitical shifts impacting oil production. Technically, the stock faces immediate support at $338 and resistance at $352.50.
TradingKey - On July 30, Valero Energy (VLO) reported second-quarter revenue of $44.48 billion, which beat the analyst consensus of $39.45 billion. The company also reported adjusted earnings per share of $12.54 as compared to the consensus estimate of $10.22. Valero's earnings surprised analysts by 27%. Net income increased by 419% to $3.7 billion compared to $714 million during the same period last year. The global supply and product inventory imbalance benefited the refining segment and sustained strong crack spreads.
Adjusted operating cash flow for the quarter was approximately $4.4 billion, of which $2.6 billion was returned to shareholders, representing a 59% payout ratio. The company also raised its dividend to $1.20 per share.
Management maintained a strong balance sheet (net debt to capital ratio is 11%, cash is $7.9 billion), and with the current supply imbalance, the company is well positioned to capture changes in mid-cycle margins. The stock traded around $346-$347 on August 19-20 after running from July earnings towards its $351 all time high. $338 provides support and resistance is at $352.50.
Q2 Earnings: Record Revenue $44.48B, EPS Beat, Refining Profit Surges 247%
Revenue: 2Q26 report records $44.476B (+49% against last year and bettered estimate of $39.45B). Net income of $3.7B or $12.62 per share GAAP against last year’s $714M. Adjusted net income of $3.7B or $12.54 per share bettered by 27% against the estimate of $10.22 per share. Reported refining operating income of $4.47B, adjusted $4.44B, up 247% against last year.
Processed 3.0M BPD of crude. Refining margin was $6.34B against last year’s $3.28B. Diamond Green Diesel processed 3.8M gallons/day.
Supported by production tax credits our Ethanol OI was $318M while last year it was $54M with a 488% increase. Cash flow from operations was $5.6B. Capex was $350M. With debt of cash net Adjusted we have a 11% balance sheet metric, a strong indicator.
Mid-Cycle Margin Thesis: Higher Floor Expected Through Cycle Downturn
Upside risk to margins expected during the upcoming cycle due to structural changes in refining economics. In management comments, reference was made to improvements in cracking economics, noting mid-cycle crack spreads are now set by hydroskim margins in the Northwest of Europe (with required carbon credit costs) rather than cracking margins. Rising OpEx and CapEx, heavy sour crude, constrained refining capacity and discounts, and discounted product inventories and supply all support the argument for improved margin floors especially given the current environment. However, the bullishness could quickly disappear if: (1) an economic slowdown occurs and decreases demand for fuel; (2) increasing geopolitical stability and decreasing tensions in the Middle East lead to a surge in U.S. production; or (3) easing of geopolitical tensions leads to a surge in U.S. production.
Shareholder Returns: $2.6B Returned, 59% Payout Ratio, Dividend Raised to $1.20
Valero returned $2.6B in Q2, representing 59% of adjusted operating cash flow. This returns capital within management’s disciplined capital allocation policy. A dividend increase to $1.20 was approved on July 16, 2026. The company has a cash position of $7.9B with a net debt to capital of 11% at the end of Q2, providing flexibility and making growth capex voluntary ($230M St. Charles FCC project Q3 startup). Long term cash surplus is around $4-5B and will be used for controlling excess cash in the markets and making strategic acquisitions.
St. Charles FCC Optimization: $230M Project, Q3 2026 Startup Expected
Valero will spend $230M to improve the FCC (Fluid Catalytic Cracking) unit at the St. Charles refinery. This project is expected to start operations in Q3 and improve the refinery's ability to produce a broader range of high value products. This is a shorter-cycle optimization project within the framework of management's disciplined capital allocation, with a $2B FY2026 capex estimate remaining in place.
VLO Technical: Support $338.15, Resistance $352.50, Stock Near $346
VLO closed trading on August 19 at $346.26, down from the intraday high of $350.73. Stock has rallied since the earnings release date July 30 and peaked at $351 on August 18, hitting a 52-week high. The stock continues to test the 23.6% Fib support that resides between $338.12 and $338.15. Support in this area can offer the stock the opportunity to test the $352.50 resistance again.
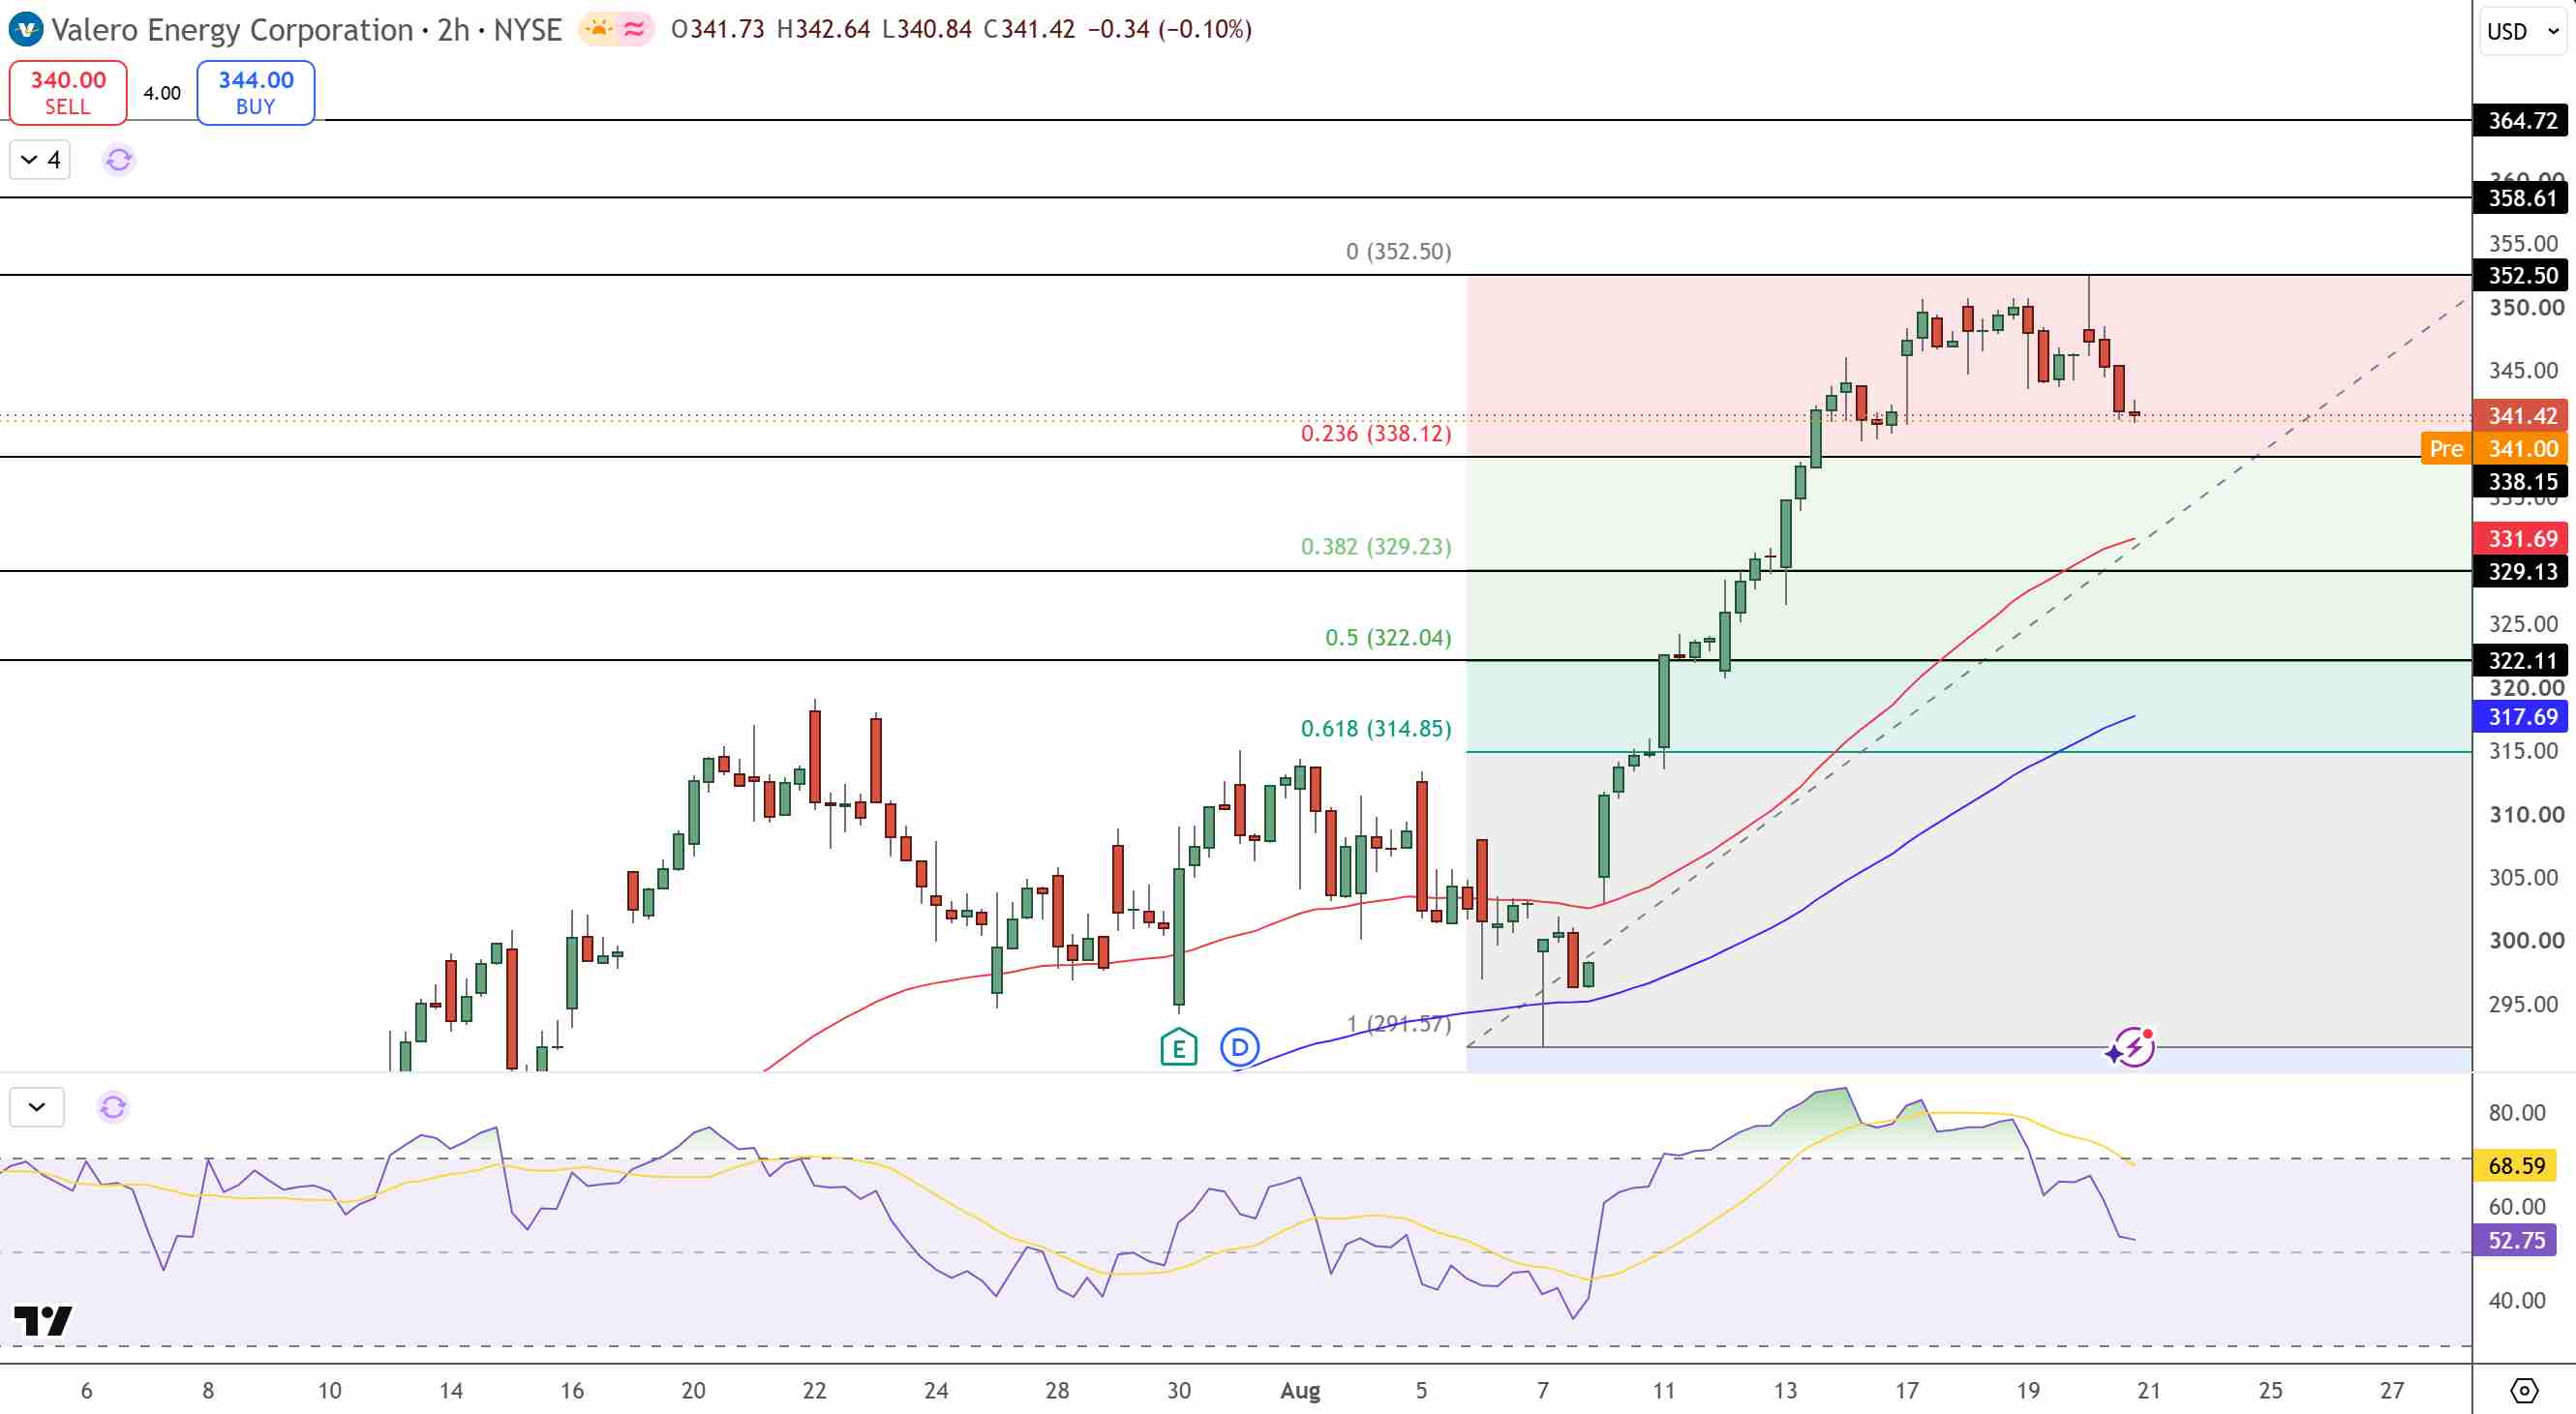
Valero Energy Price Chart - Source: Tradingview
If the resistance is surpassed the next levels of resistance reside at $358.61 and $364.72. If VLO breaks below $338 the next levels of support reside at $329 to $331.69, the 38.2% Fib level. The RSI is currently at 53 (signal 69), which is showing slightly cooled momentum but is still bullish.
Key Levels
- Immediate support: $338.12-$338.15 (23.6% Fib)
- Next support: $329-$331.69 (38.2% Fib)
- First Resistance: $352.50 (recent high)
- Next Resistance: $358.61, $364.72
- 52 week high: $351.00 (Aug 18, 2026)
Bottom Line: Record Q2, Margin Thesis Intact, But Macro Caution Warranted
VLO Q2: Revenue $44.48B (+49%, beat), EPS $12.54 (beat $10.22). Refining OI $4.47B (+247%). Renewable diesel $717M (vs -$79M). Ethanol $318M (+488%). Cash returns $2.6B (59% payout). Dividend $1.20. Debt-to-cap 11%. OCF $5.6B. St. Charles FCC $230M, Q3 startup.
For investors: Valero has operationally strong earnings and record profits. From an investment margin standpoint, the mid-cycle thesis is justified as long as macro environment stays tight. Valero's balance sheet is in good shape with 11% net debt to equity. Jackson Hole Fed (Aug 27-29) should give us a better idea of the macro environment. $338 is key support. Breaking below $338 exposes a fair amount of risk at $329. Risk is present over the macro environment and value is not investment advice.
Recommended Articles











Comments (0)
Click the $ button, enter the symbol, and select to link a stock, ETF, or other ticker.