


SpaceX Stock Forecast: Push Toward $150 Stalls, Short-Term May Retest $100 Support



AI Podcast


SpaceX stock faces short-term downward pressure, potentially testing $135 or lower, after retreating from a surge driven by Musk's AI revenue claims. On August 14 Eastern Time, the stock traded at $142.51 following a nearly 10% jump to $148.79. The $150 level acts as strong technical and psychological resistance due to heavy trapped capital from the IPO debut and selling pressure from early August insider share lockup expirations. Lacking major catalysts, technical indicators suggest a correction toward the $135 Fibonacci support level, with a breach risking a drop toward the $100 mark.

TradingKey - SpaceX stock retreats after a surge and may test $135 or lower in the short term.
On August 14 Eastern Time, SpaceX (SPCX) stock continued to fluctuate, rising 0.86% in pre-market trading to $142.51. On Wednesday (August 12), Musk claimed that AI revenue next month would surpass Starlink and rocket launches, Starlink and rocket launches, driving SpaceX stock up nearly 10% to an intraday high of $148.79, approaching its first-day opening price of $150 and hitting a one-month high.
Currently, SpaceX is locked in a high-level tug-of-war before the $150 round-number level and showing signs of a pullback, reflecting strong resistance at this position with a large backlog of potential selling pressure. The two main sources are breakeven selling around the IPO opening price level and potential selling following the initial lockup expiration.
On June 12, SpaceX opened at $150 on its IPO debut and surged rapidly during the day, reaching a high of $176. This indicates that $150 accumulated a significant amount of trapped capital buying at high levels. As the stock strongly rebounded from its early August low to its current position, trapped positions and short-term profit-takers sought to break even simultaneously, creating strong psychological and technical resistance.
In addition, around 911 million insider and employee shares were unlocked in early August. Although the market absorbed the initial wave of selling pressure, executives and early VC capital have a strong desire to lock in profits in tranches above $150, which also limits short-term upside momentum.
For SpaceX, the current lack of major catalysts combined with potential selling pressure from multiple forces leaves its stock under significant pressure. From a technical analysis perspective, SpaceX stock pulled back after testing the 0.382 Fibonacci resistance level and will correct downward to around $135 in the short term, which is SpaceX's IPO price and also the 0.236 Fibonacci resistance level. If it breaks below this level, it will return to near the $100 mark, the starting point of the rebound.
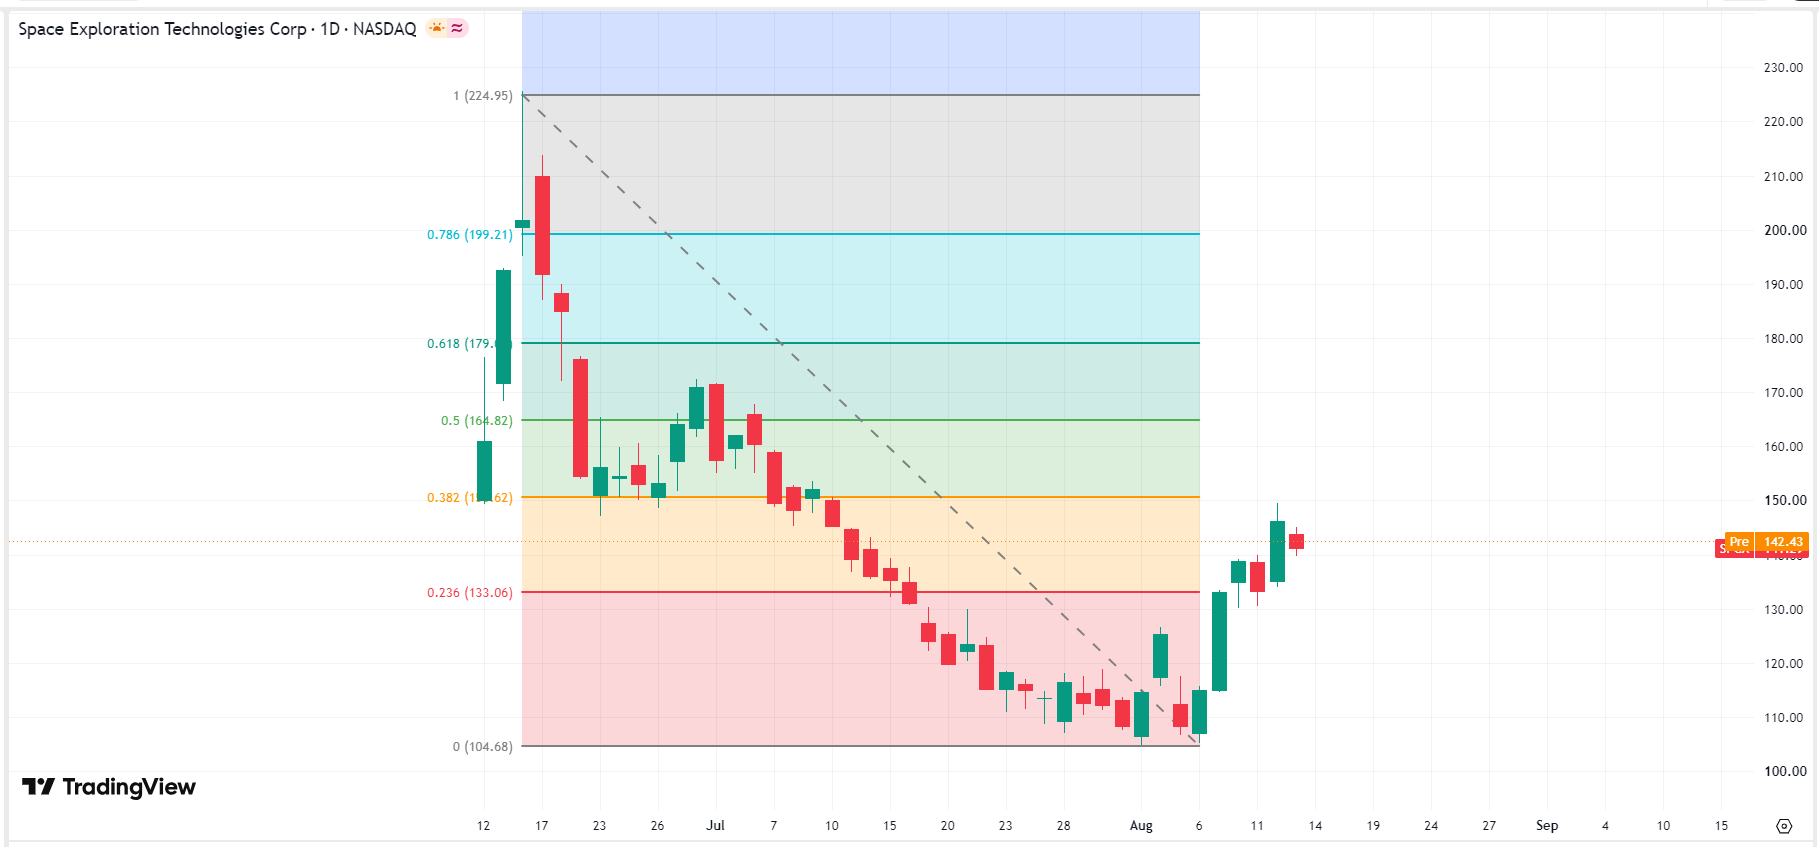 SpaceX stock chart, Source: TradingView
This content was translated using AI and reviewed for clarity. It is for informational purposes only.
Recommended Articles











Comments (0)
Click the $ button, enter the symbol, and select to link a stock, ETF, or other ticker.